Comparative overview of distribution of Y-DNA haplogroups in Europe
We hope this can be useful to any layman or enthusiast of Genetic Geneology who wants to quickly learn about distribution of main haplogroups in Europe.
Beside displaying distribution of main haplogroups, this charts are also intended for easy comparision of haplogroup frequencies among countries/peoples of Europe. Since frequencies for many countries/peoples are made with small number of available haplotypes, we do not display exact numbers. Charts might be also useful for noticing regions of Europe where some haplogroup peaks.
Упоредни преглед расподјеле Y-ДНК хаплоскупина Европе (in serbian)
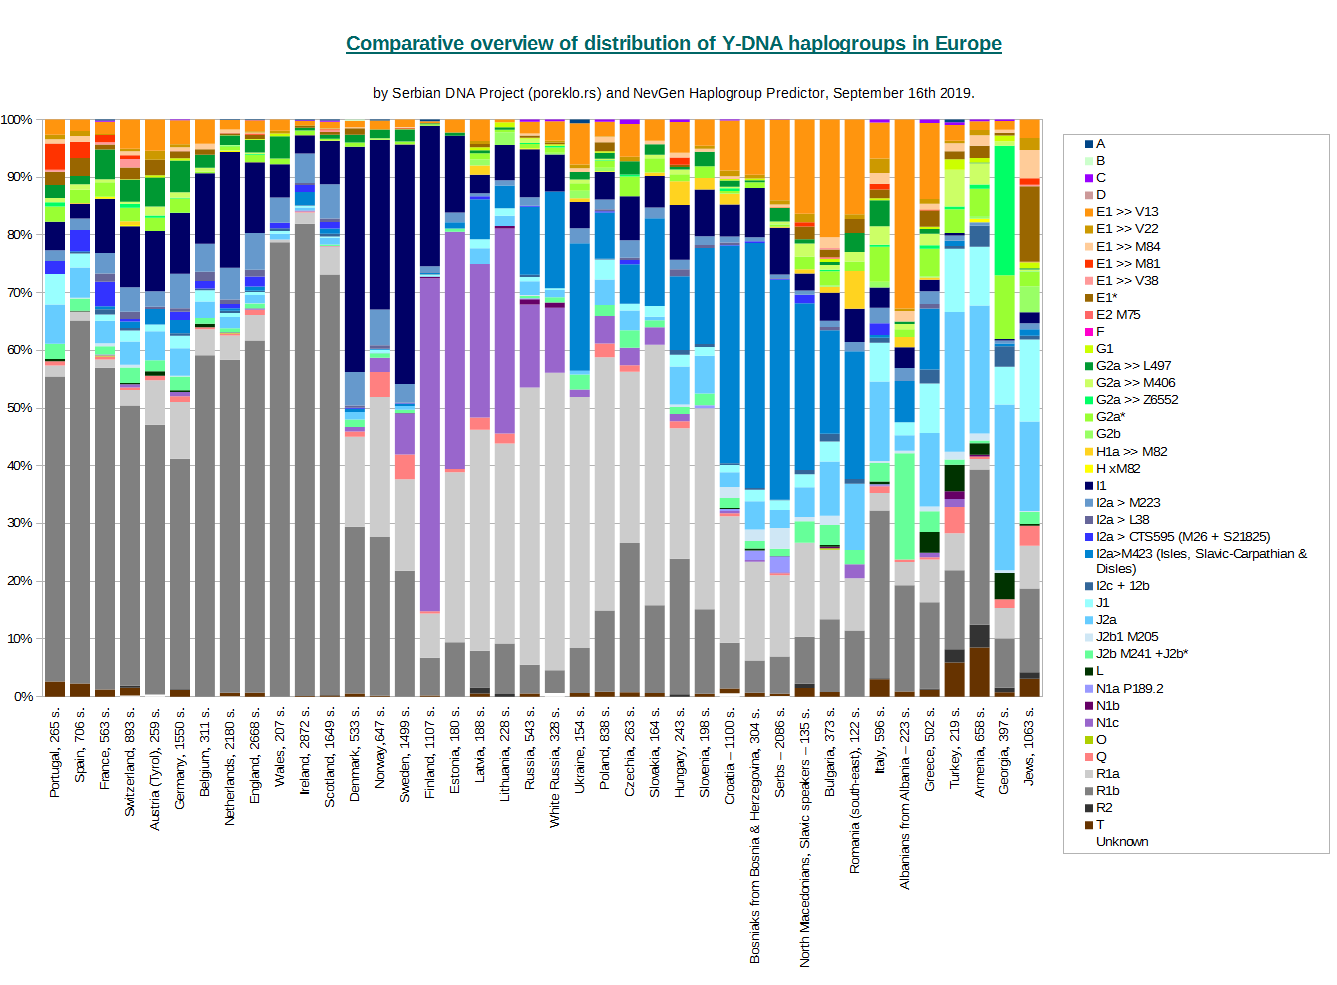
Both charts display the same information, we made available both of them for reasons of personal preference of readers. Horizontal version seems to be more easy to connect country with its distribution representation in its bar.
With each name of country/people on charts, number of samples used is displayed.
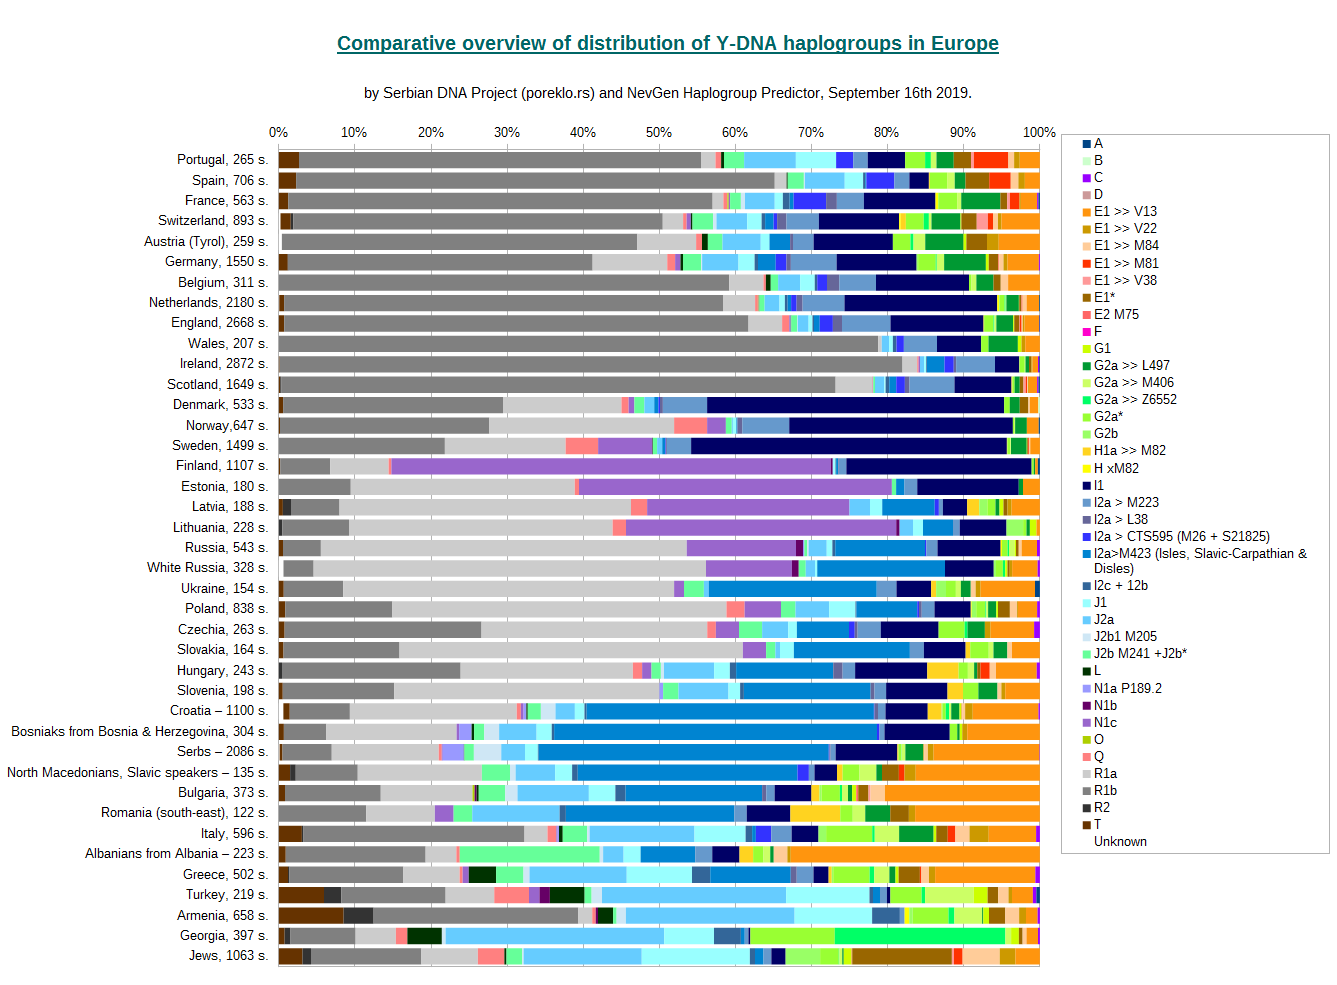
For classification of haplotypes into predefined haplogroups was used NevGen Predictor. Majority of them were classified automatically, but in some cases, especially for short haplotypes (17 or 23 markers), manual review was needed to put them into the right clade. In some cases was not possible to predict haplogroup with any certainty, and those are displayed in Chart with white colour ("Unknown", at the bottom/left of bars). Several such cases are known in croatian, serbian, whiterussian, austrian and swiss samples.
Sources of data: academic collections of haplotypes (usually 23 or 17 markers wide, for example Netherlands, Switzerland, Austria, Romania, Hungary, White Russia, Russia, Albania, Croatia, Slovenia ...), and haplotypes from public FTDNA projects (British Isles, Scandinavian countries, France, Spain, Portugal, Poland, Germany, Jews, Bulgaria, Italy, Turkey...). In some cases, 12-markers haplotypes were not used. In some cases, we combined both sources (for example Slavic speaking North Macedonians, Czechia, Armenia, Denmark, Lithuania, Latvia, Greece ...). For Serbs, data (2083 haplotypes on 23 or 17 markers) came from several actions of mass testing done in last several years. For Jewish people, we used data from Public Jewish FTDNA Project. Short (12 markers) haplotypes were not used. Haplotypes from sections which contain samples who had not verified it's Jewish ancestry (to Project's Admins) were not used too.
Unfortunately, some countries are very poorly represented here, and that might be the reason why frequencies for some countries are much different from frequencies shown on Eupedia. For example, for Austria are available only haplotypes from Tyrol. And for Romania, only haplotypes from south-east (FTDNA data is scarce, and more importantly, not representative). If we find any other usable source, we shall add it to our statistics. For several countries we have no appropriate haplotype data at all (Moldova, Iceland ...).
We prefer data divided by etnicity rather than by country, but it was available only in few cases. We hope more such data shall be available some day.
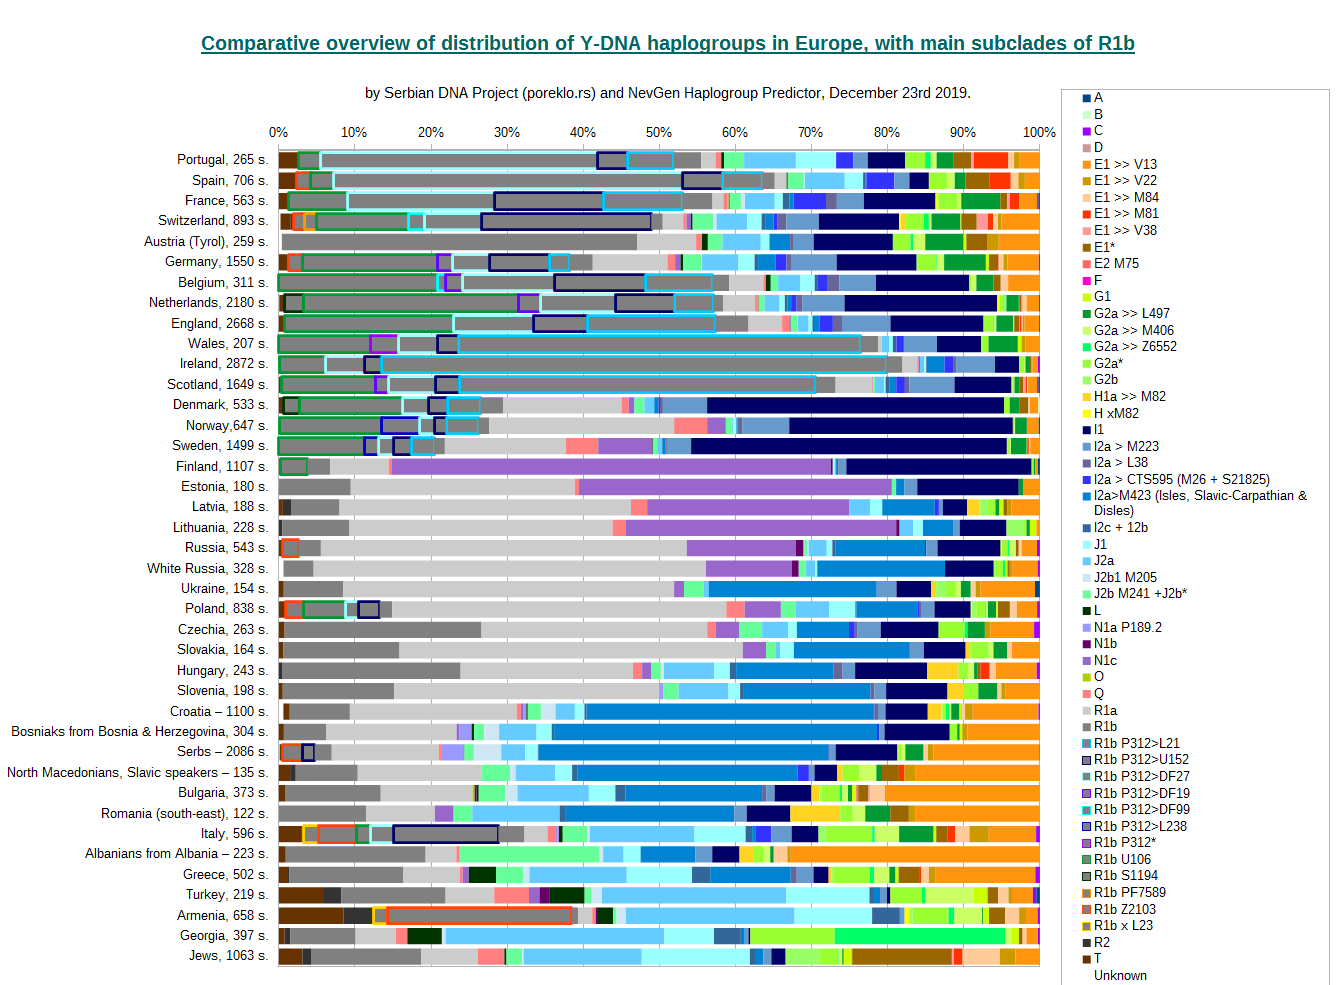
Previous chart, as we had promised, contains also division of R1b into several of it's main branches. Basic colour (dark gray) remains the same for them, but they are encircled with different colours to mark different main R1b subclades. For some countries we have no apropriate data to determine R1b subclades with any certainty (23 and 17 markers-long haplotypes are usually very poor to distinguish among different R1b subclades), and consequently we have no R1b division for many countries, for example Greece, Austria, White Russia. Also, some part of R1b remains unspecified, that are frequencies of the remainder of R1b subclades, which are too small to be displayed properly.
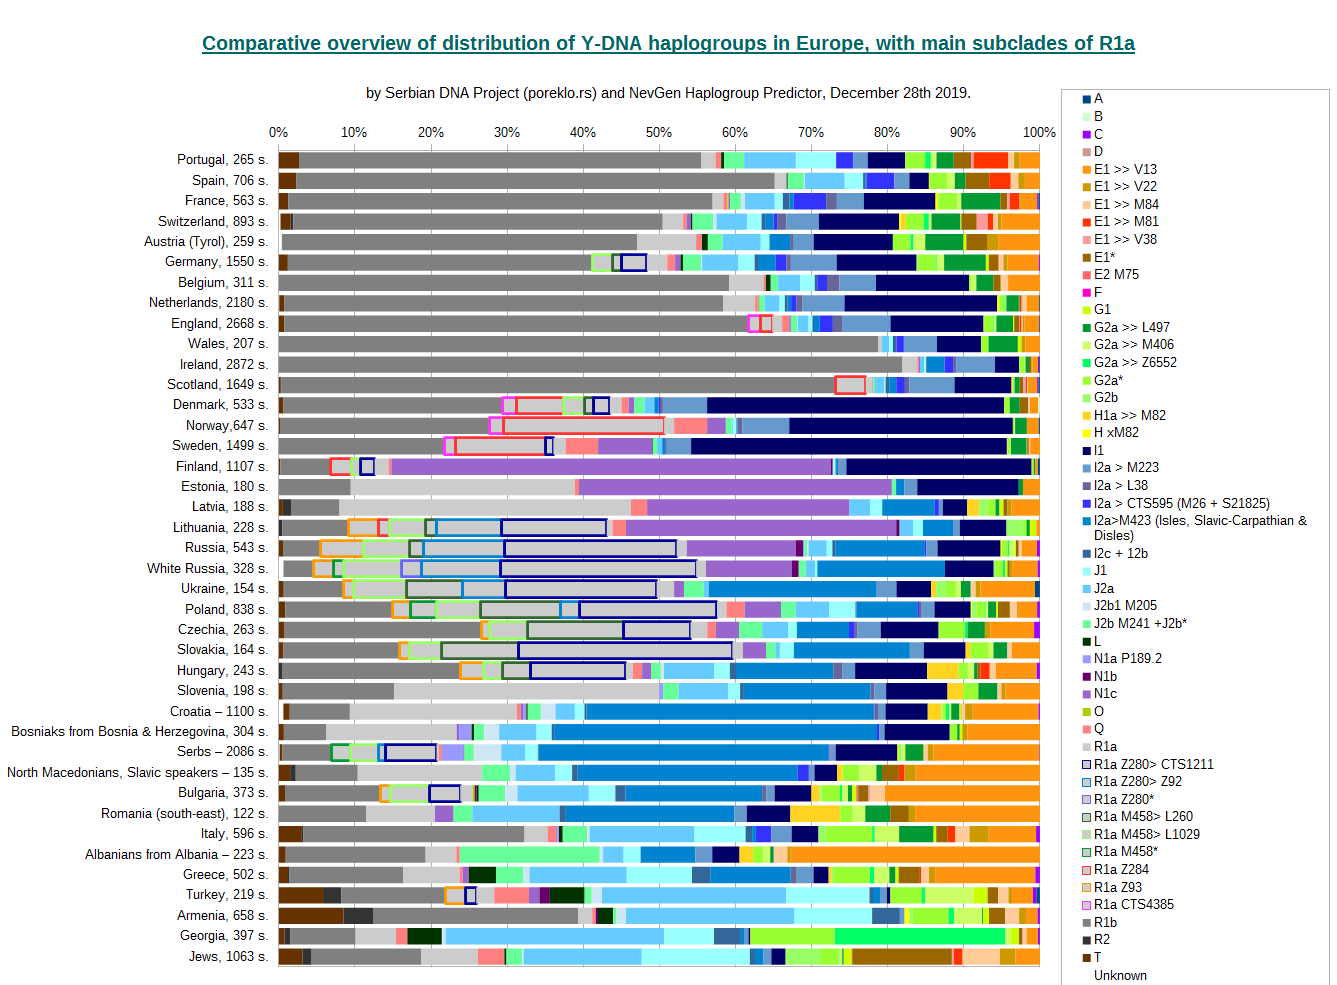
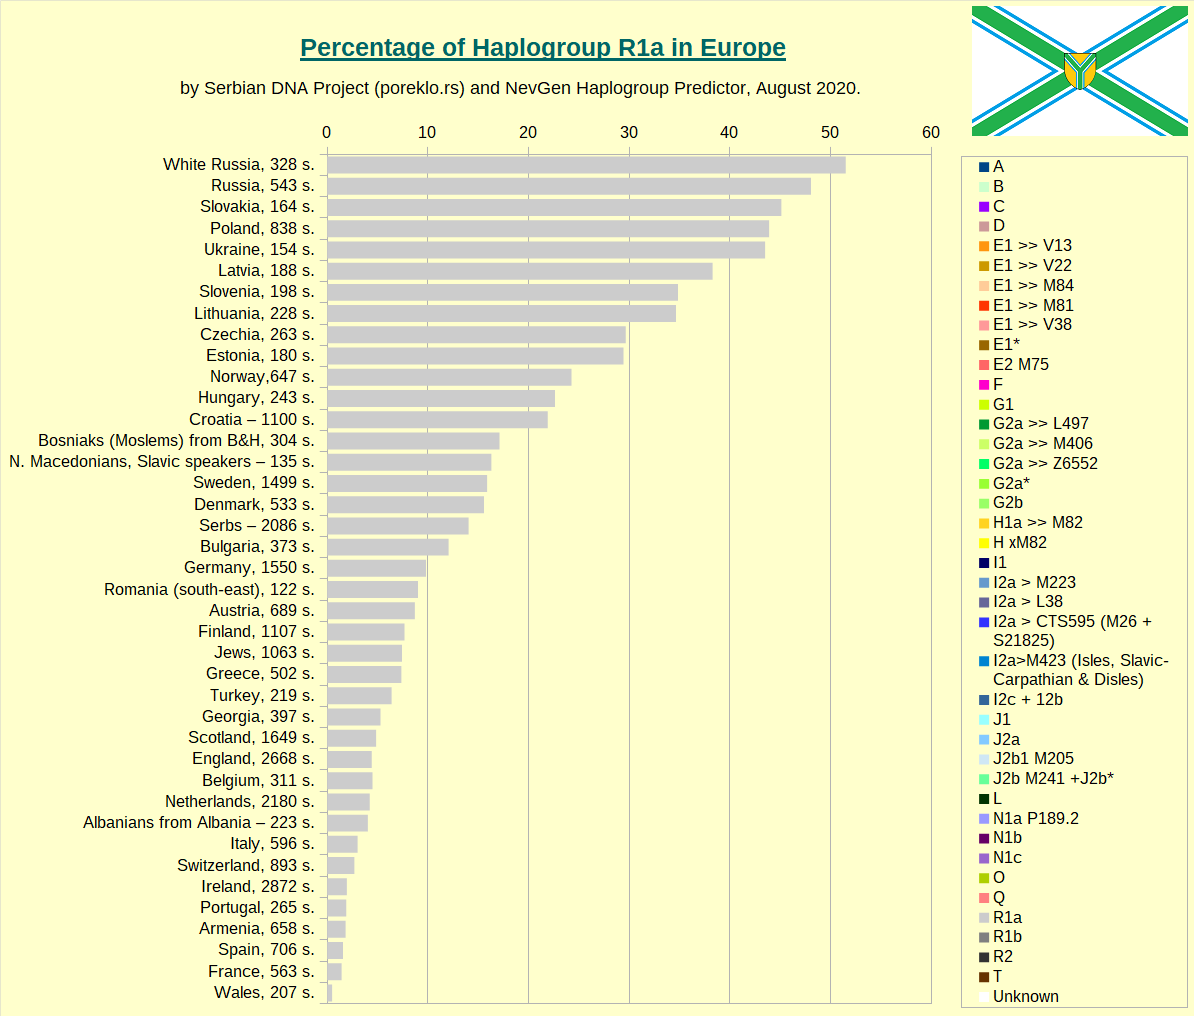
And here is similar division of R1a, for several countries where it is more numerous. Here you can easily differentiate typical Slavic subclades, like M458 (green) and Z280 (blue), from typical Germanic Z284 (red) and CTS4385 (magenta). For some might be surprise (but not for me) that in Germany, most of R1a seems to be of Slavic, not of Germanic origin. And Denmark seems to have huge part of Slavic R1a.
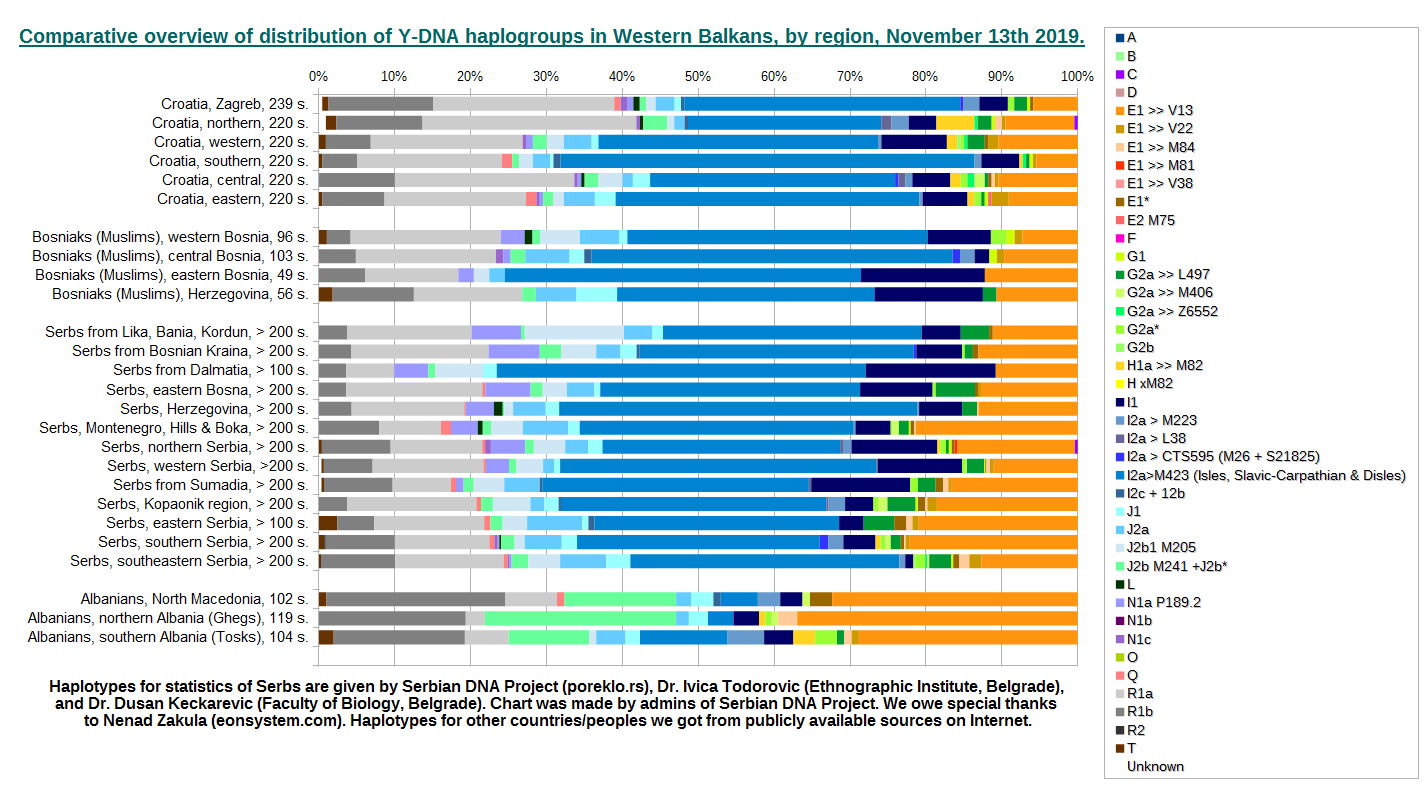
This is overview of Y-DNA haplogroup distribution of western Balkans country Croatia and three peoples: B&H Moslems (Bosniaks), Serbs, and Albanians, divided into several regions.
For more information about chart, please see here.
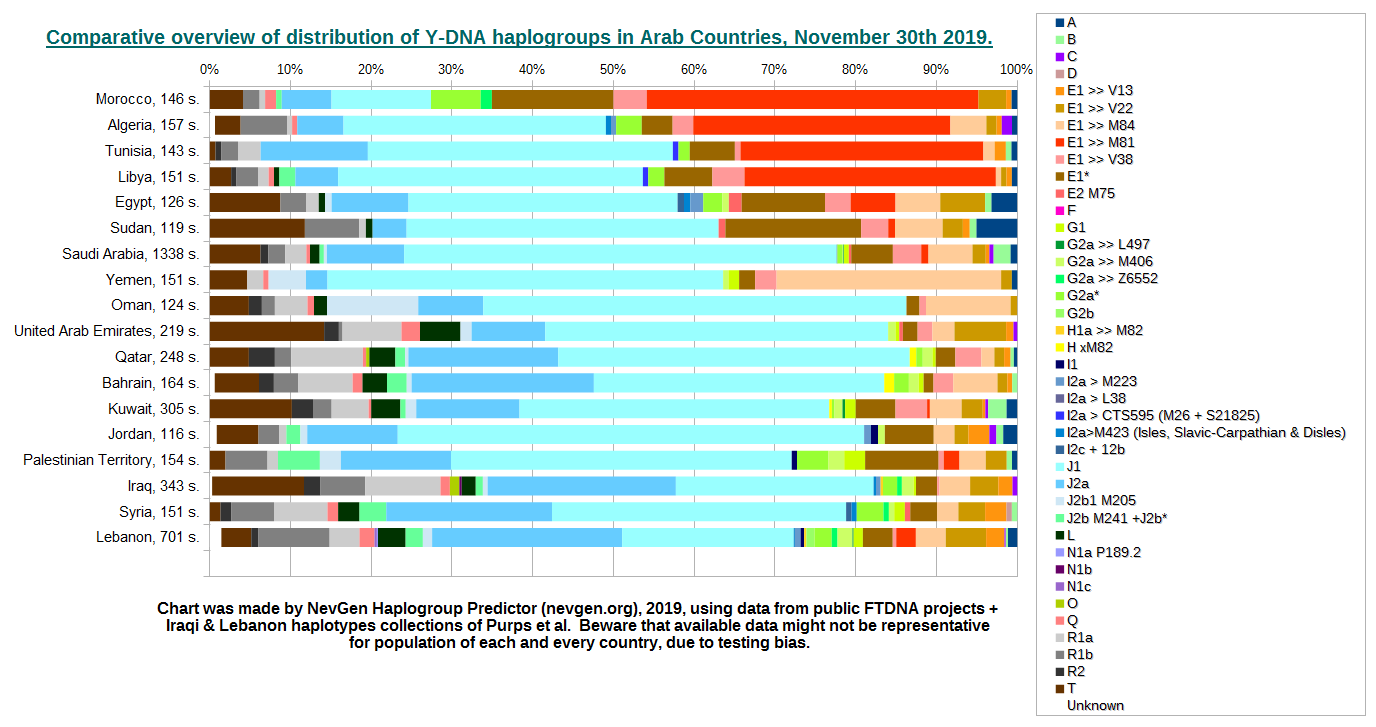
This is overview of Y-DNA haplogroup distribution of Arab countries. Statistics was made mostly from data which could be found on public FTDNA projects. Beside them, were used two haplotype collections from Purps et al. First is from Lebanon (505) and second is Iraq (124 haplotypes). Visitors should be aware that statistics made from public FTDNA projects might not be quite representative. Not only for reason of small number of available haplotypes for some countries (many have less than 200 haplotypes). Another, and more important reason is that some subpopulations (extended families, tribes, ethnicities, people from specific regions, etc...) are prone to be more tested than other subpopulations, and even to be more or less prone to join any public FTDNA project. And this can significantly distort our statistics.
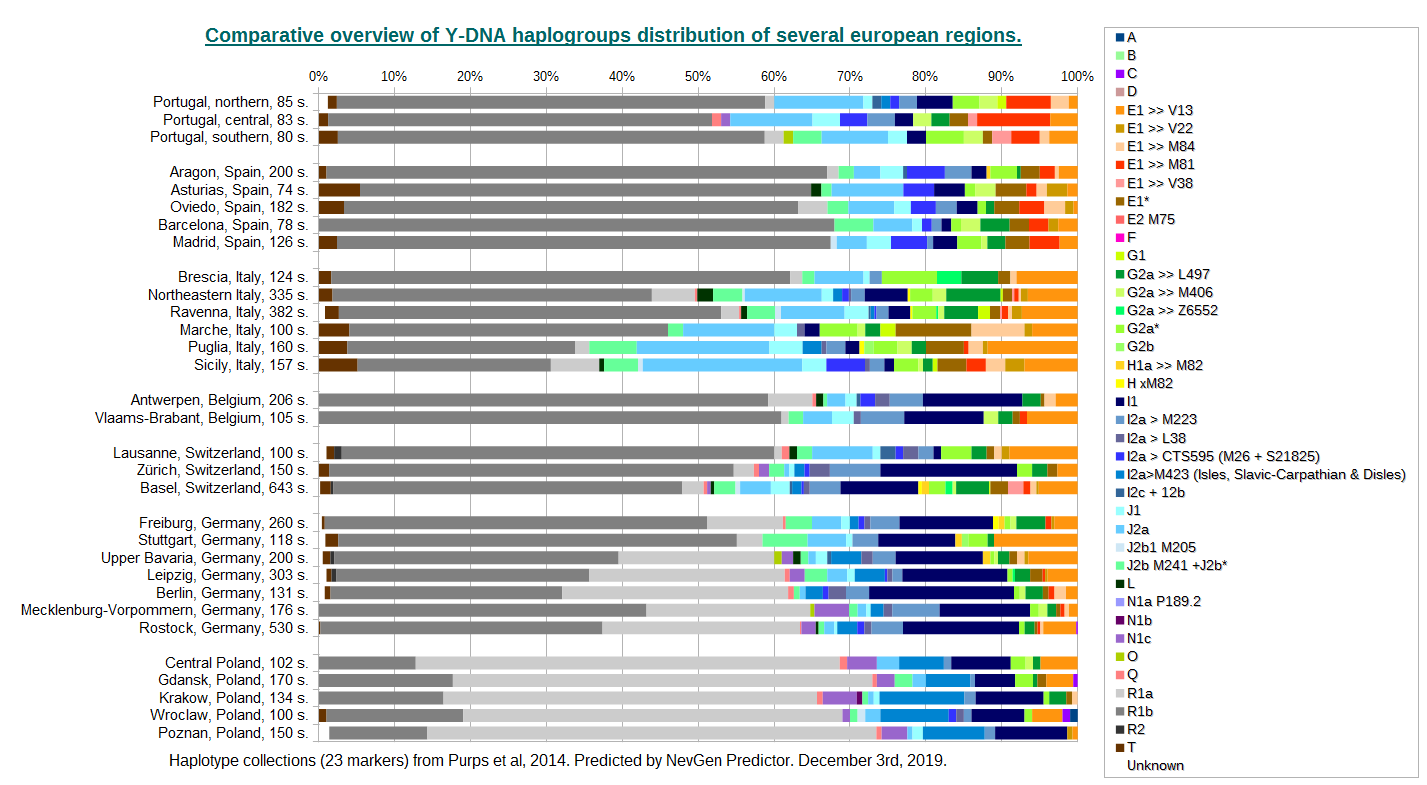
This is overview of Y-DNA haplogroups distribution of the several european regions. Statistics was made using 23-marker collections only, all from "Purps et al, 2014".
I must admit that I have had problems with veracity of three haplotype collections, which had strangely low average fittneses for Europe. The first was collection from Stuttgart, Germany, where in many cases values of DYS437 and DYS438 were exchanged. This error was easy to find and fix, and then I got normal average fitnesses. Polish haplotypes collection from Poznan was somewhat harder nut to break, better fitness I got only after removal of DYS481 and DYS643 from prediction. I believe those markers were mixed up among different haplotypes. And the worst case was haplotype collection from Bialystok, Poland. I spent several hours trying to find what is wrong with it, but I finally gave up. I believe markers were exchanged among haplotypes on a larger scale, and I found it too hard to solve for such small benefit.
I also noticed another strange thing. Haplotype collection from Lausanne (Switzerland) contains only one I1 haplotype (out of 100). But, city of Zürich, also in Switzerland, just about 170 km far by straight line, has 27 out of 150 samples, which makes it 1% vs 18% of I1. It looks very strange to me.
I also noticed three exotic samples in German haplotypes, that probably belong to different subclades of Haplogroup O. None of them has matches in Europe. Two of them are from Upper Bavaria, one of them has excelent fit into O2a1 F51, and has several close matches in China. Third is from Mecklenburg-Vorpommern, and has moderate fit into O1b1 F2320, and has several matches in Vietnam.
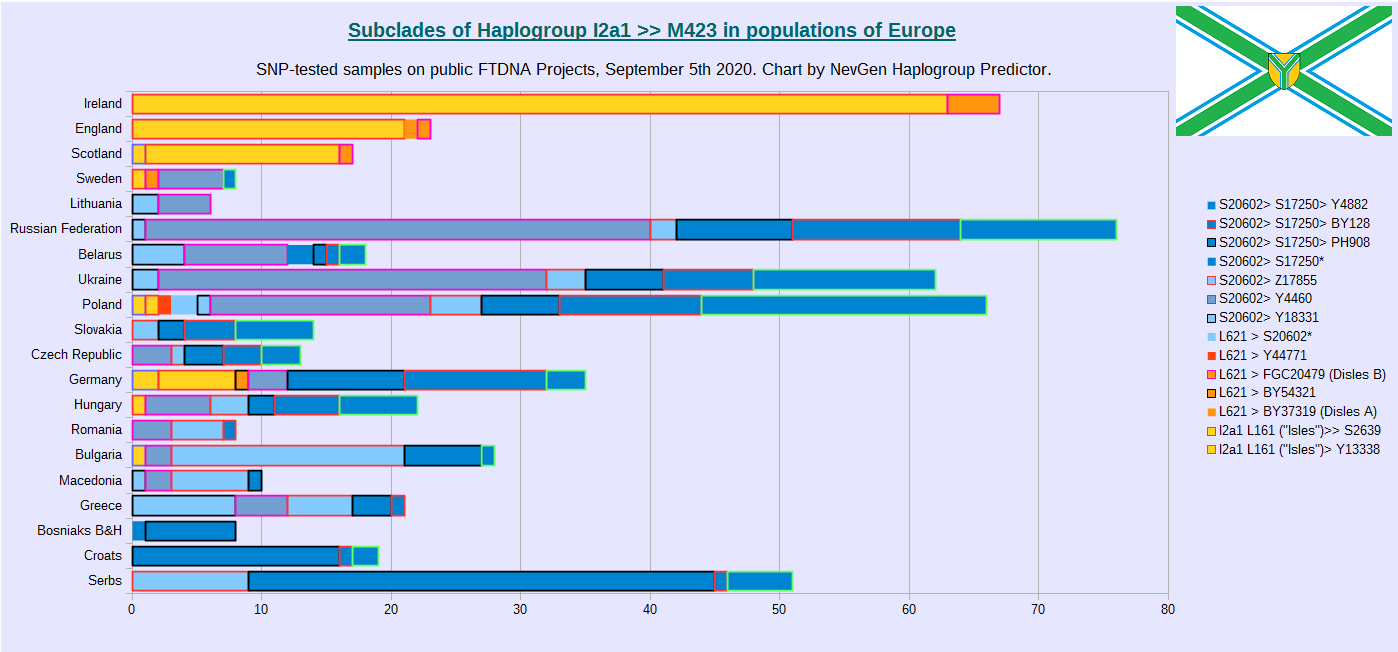
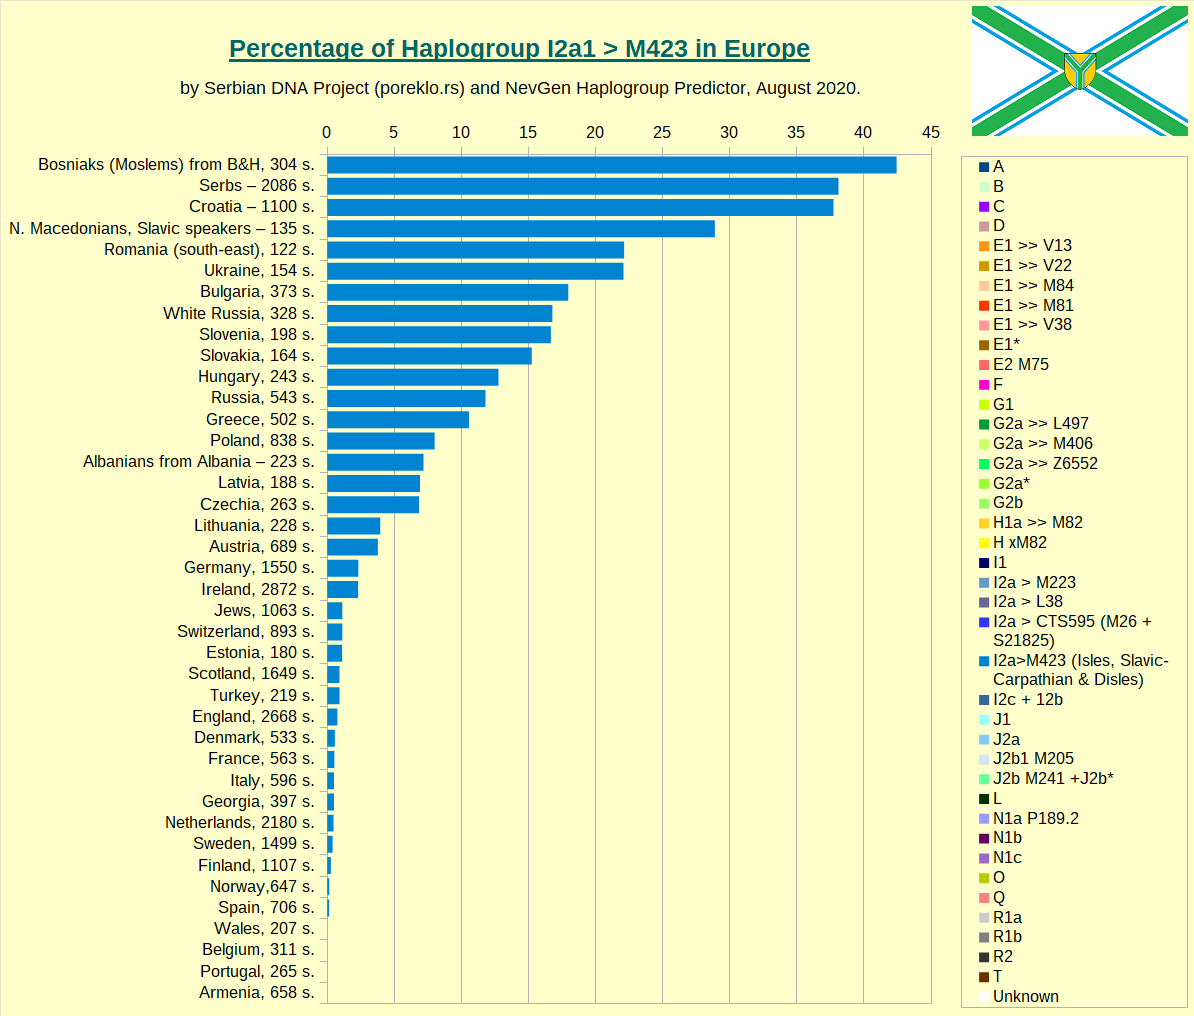
In previous chart we can see distribution of subclades (by number of samples) of Haplogroup I-M423 in Europe, by countries or populations. For this statistics were used samples from public FTDNA Projects, only those who were deep SNP tested.
Here we can see that most of variation and diversity we have in Poland and Germany, despite it's moderate frequencies, closely followed by other central and eastern European countries.
Despite haplogroup I-M423 reaches highest frequencies in Dinaric Alps region (Western Balkans), that is also region with it's smallest variation, where live Croats, Muslims of Bosnia and Herzegovina, and Serbs.
Subclades under L161 are unheard of there, only Slavic-Carpathian S20602 can be found, and the most of it belongs to PH908, and Z17855 or Y4882 subclades in smaller degree.
Even Eastern Balkan countries like Bulgaria and Greece has greater diversity of haplogroup I-M423.
This is one of many reasons why Western Balkans can not be place where I-M423 originated, nor it's descendant Slavic-Carpathian subclade S20602. Which some people in Balkans claim.
If you want to support Serbian DNA project you can do it through the donation on our PayPal Аccount Аddress: donacije@poreklo.rs
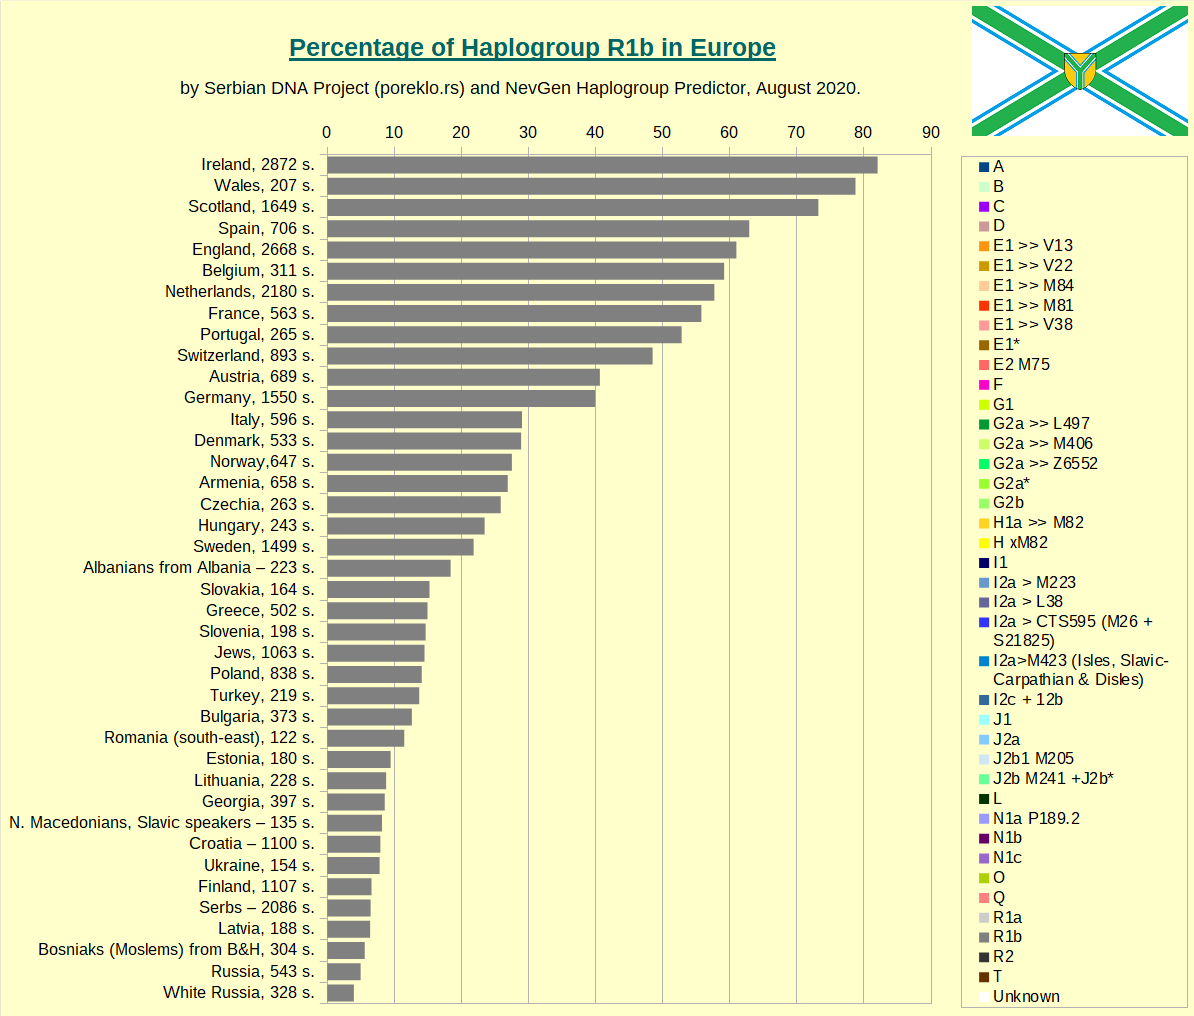
In next section are displayed several charts with countries (or peoples) sorted by percentages of certain main haplogroups, which are important in Europe. Data used are the same as in first two charts (Comparative overview of distribution of Y-DNA haplogroups in Europe), except for Austria, where available data was increased by two additional haplotypes collections, one from Salzburg and another from Upper Austria.
Beware that percentages are calculated in some cases by small number of haplotypes, which might be not perfectly representing some european countries or peoples, so this charts should be taken with caution, and a exact order might not be one shown here.
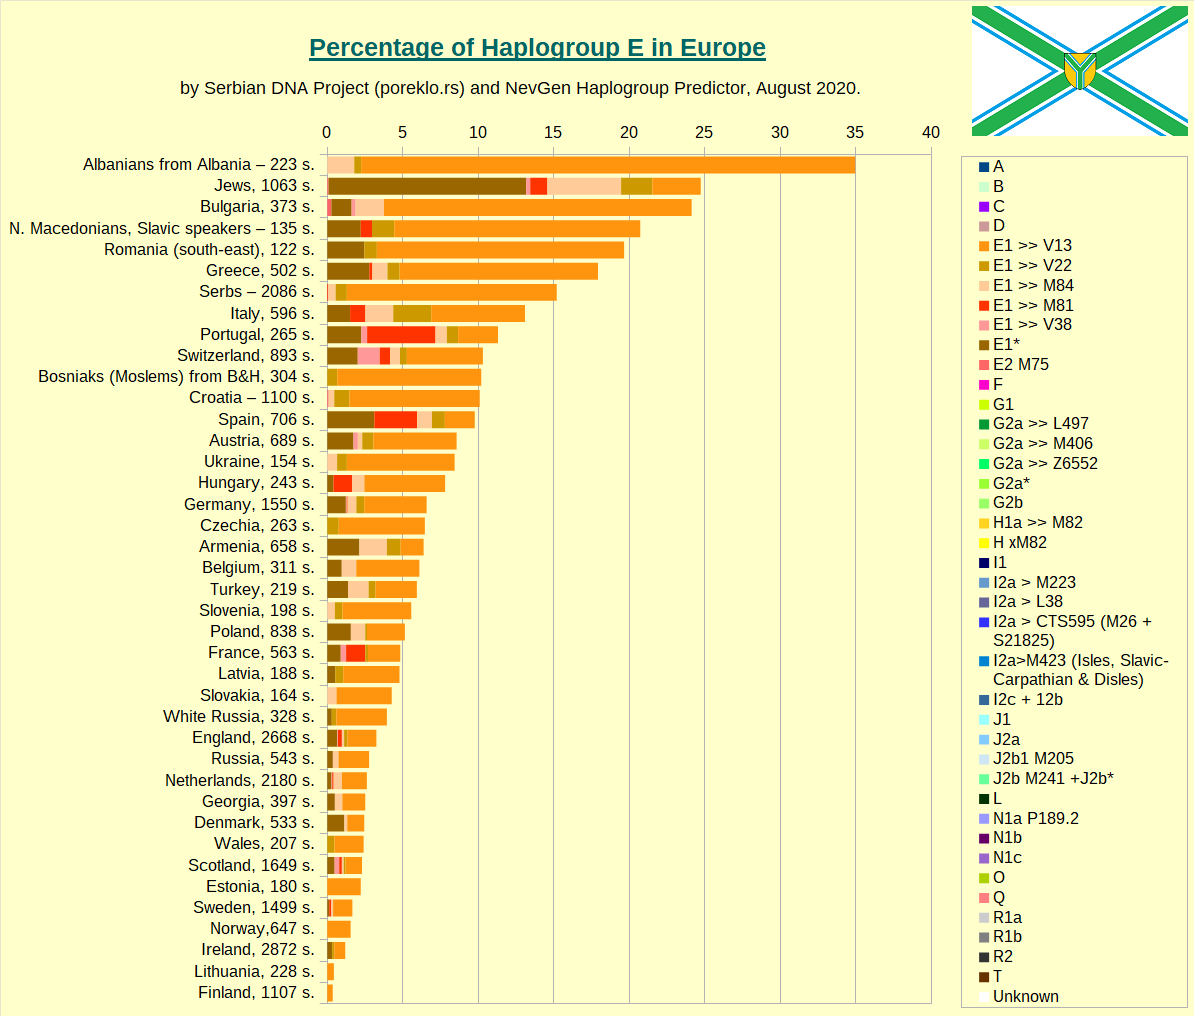
First is Haplogroup E.
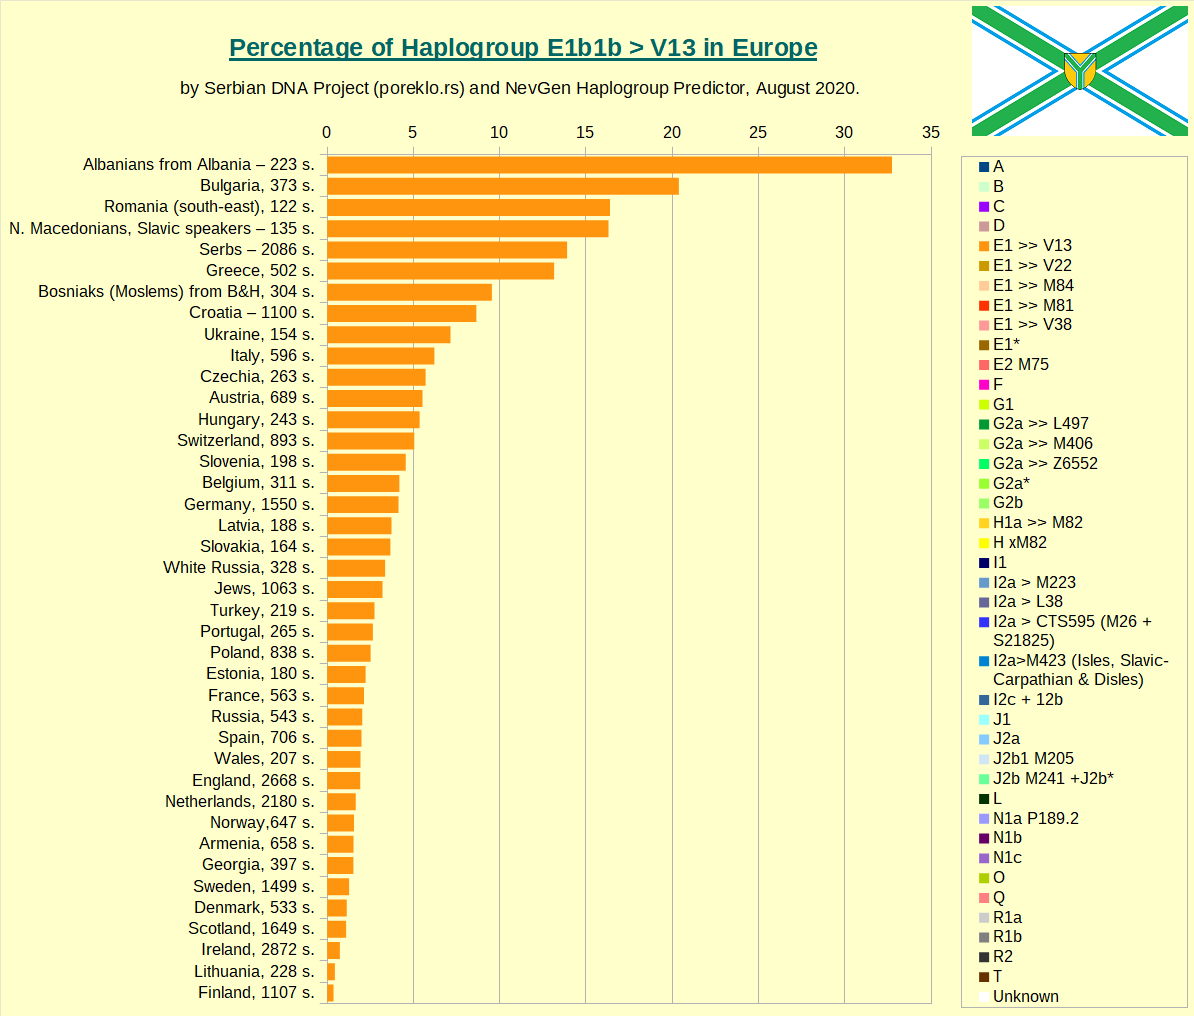
Then comes Haplogroup E-V13, the main E subclade in Europe.
Haplogroup G in Europe.
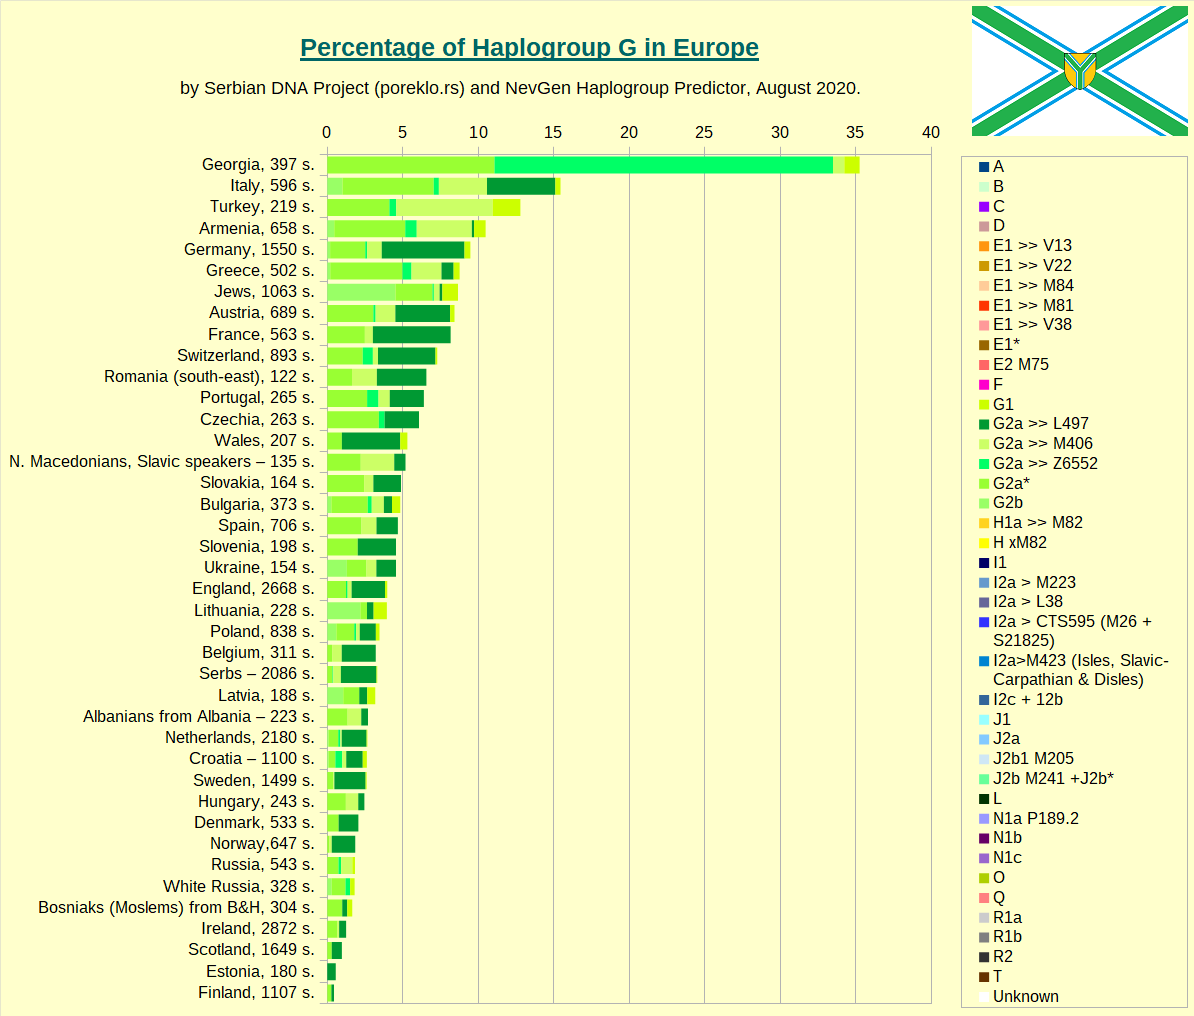
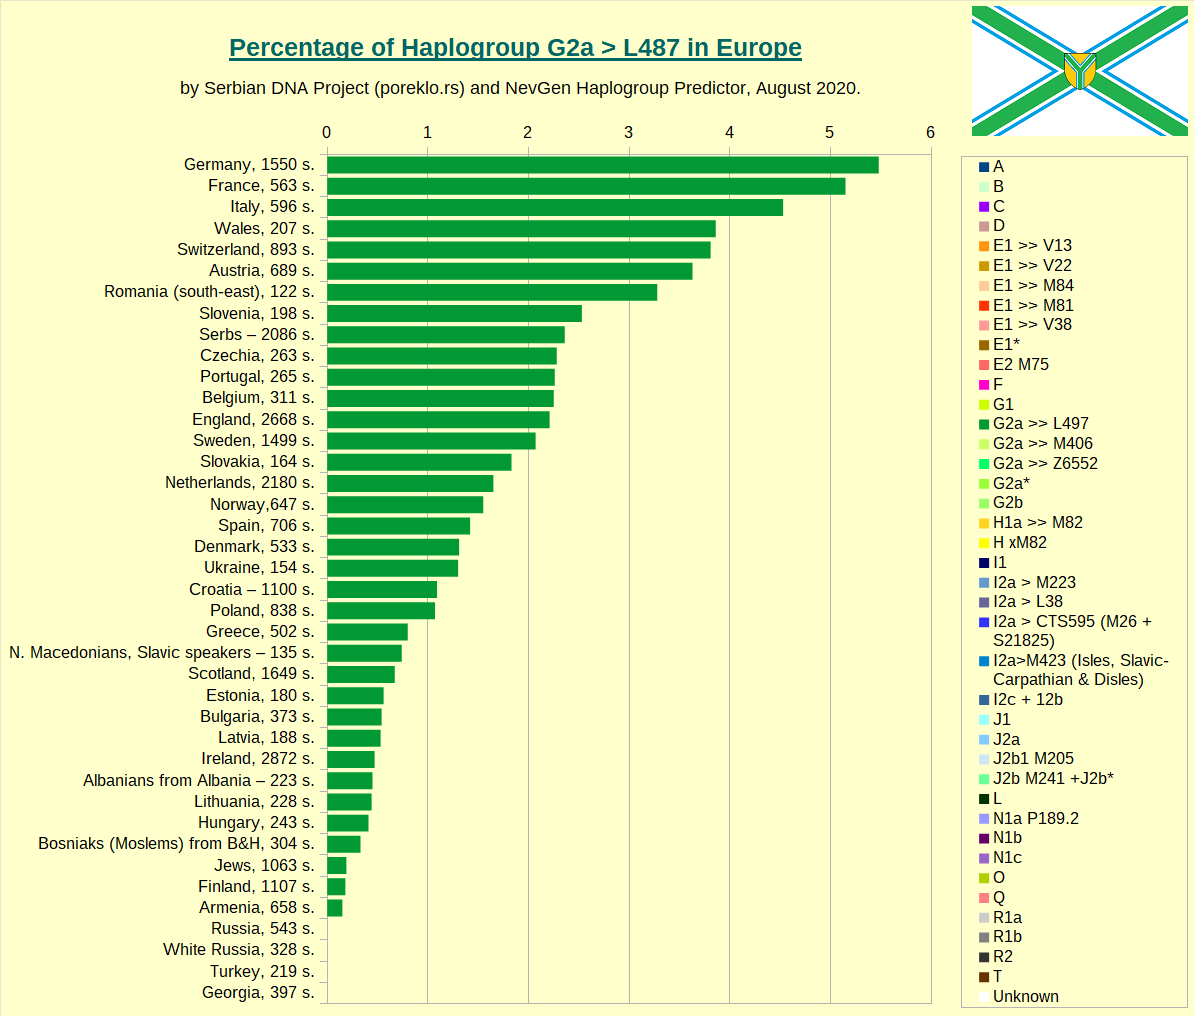
Haplogroup G-L497 in Europe, the main european clade of Haplogroup G.
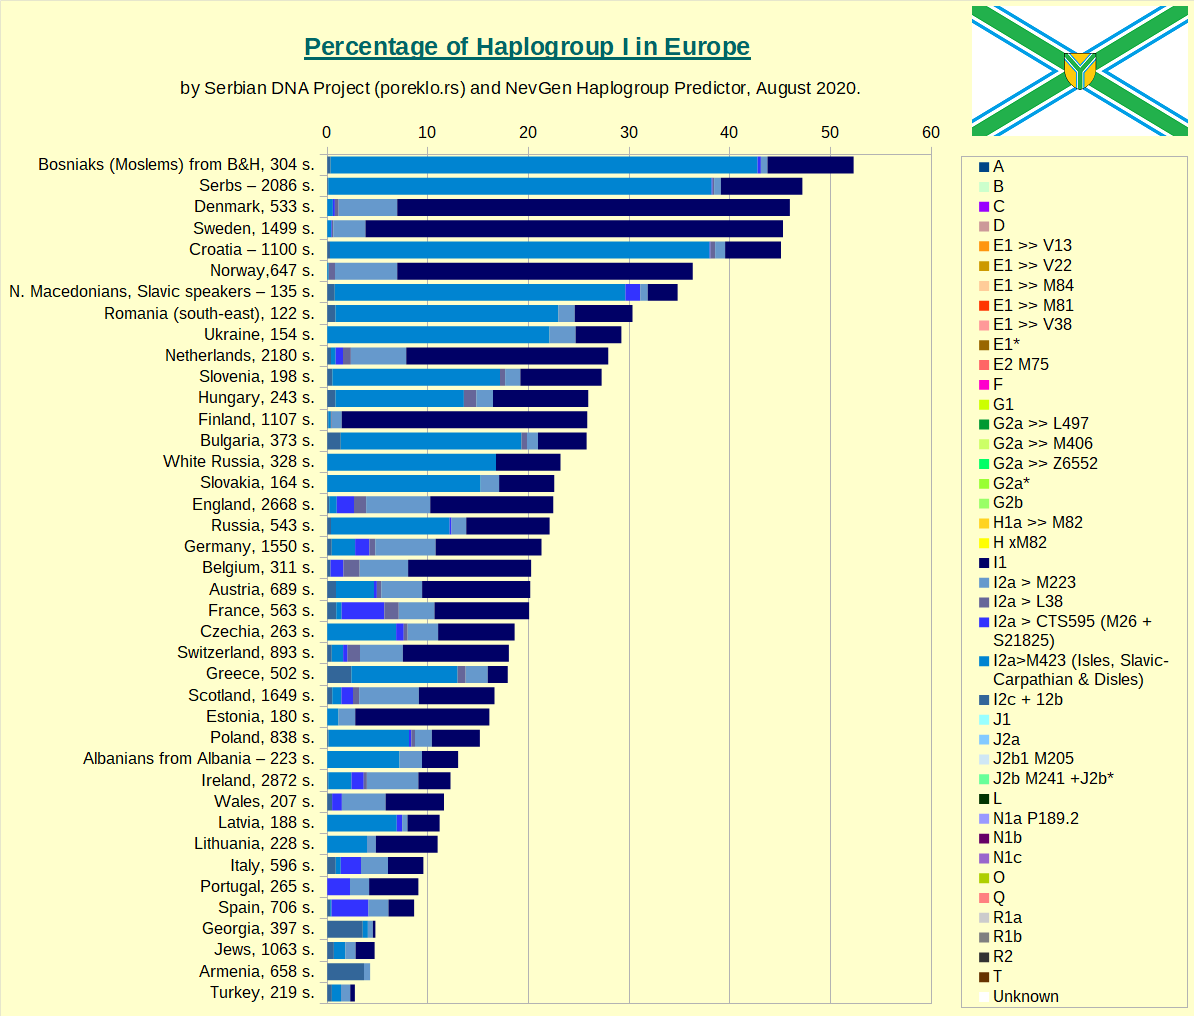
Haplogroup I in Europe, taken as whole.
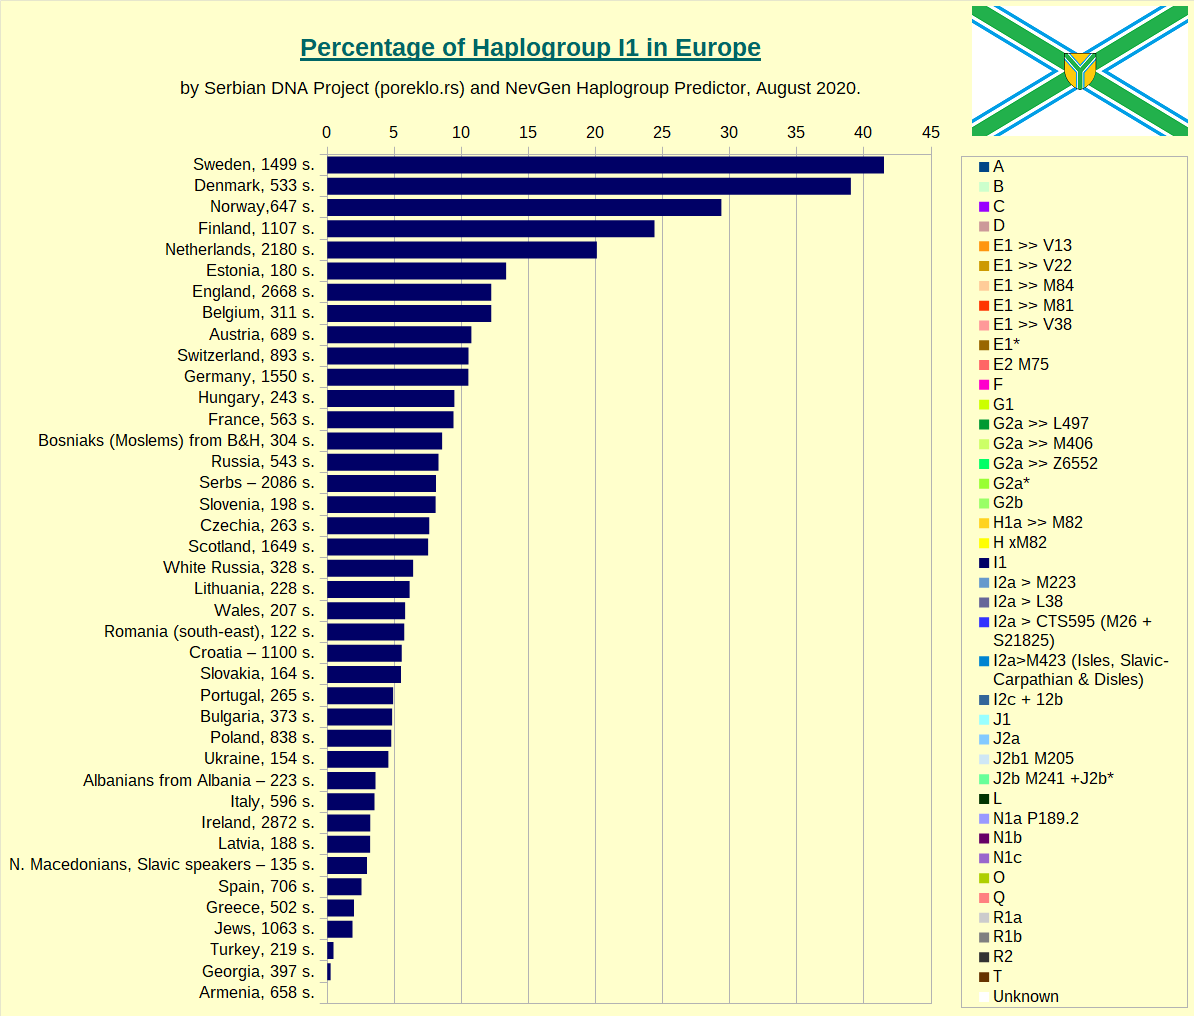
Haplogroup I1 in Europe.
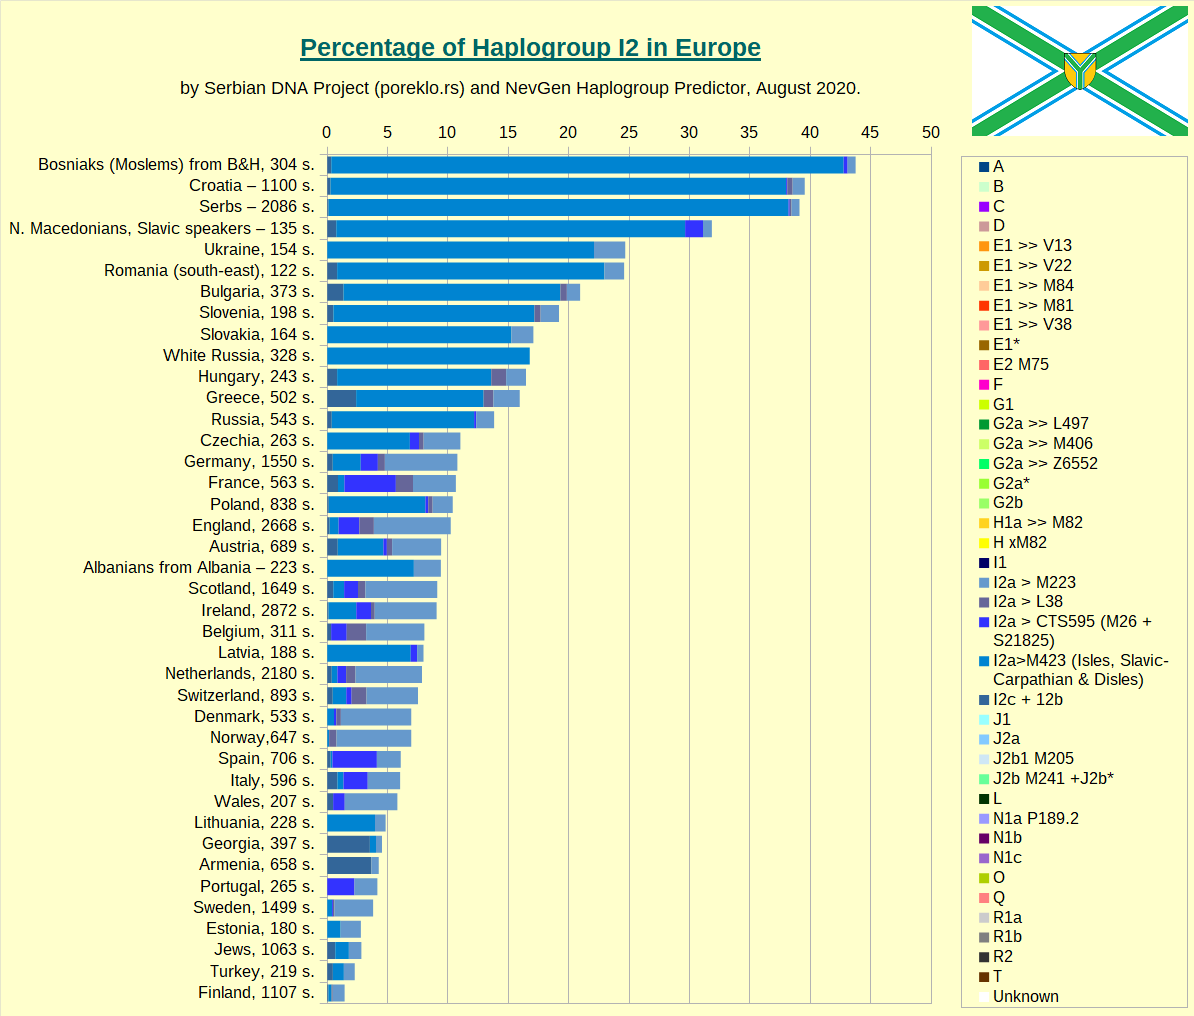
Haplogroup I2 in Europe, taken as whole.
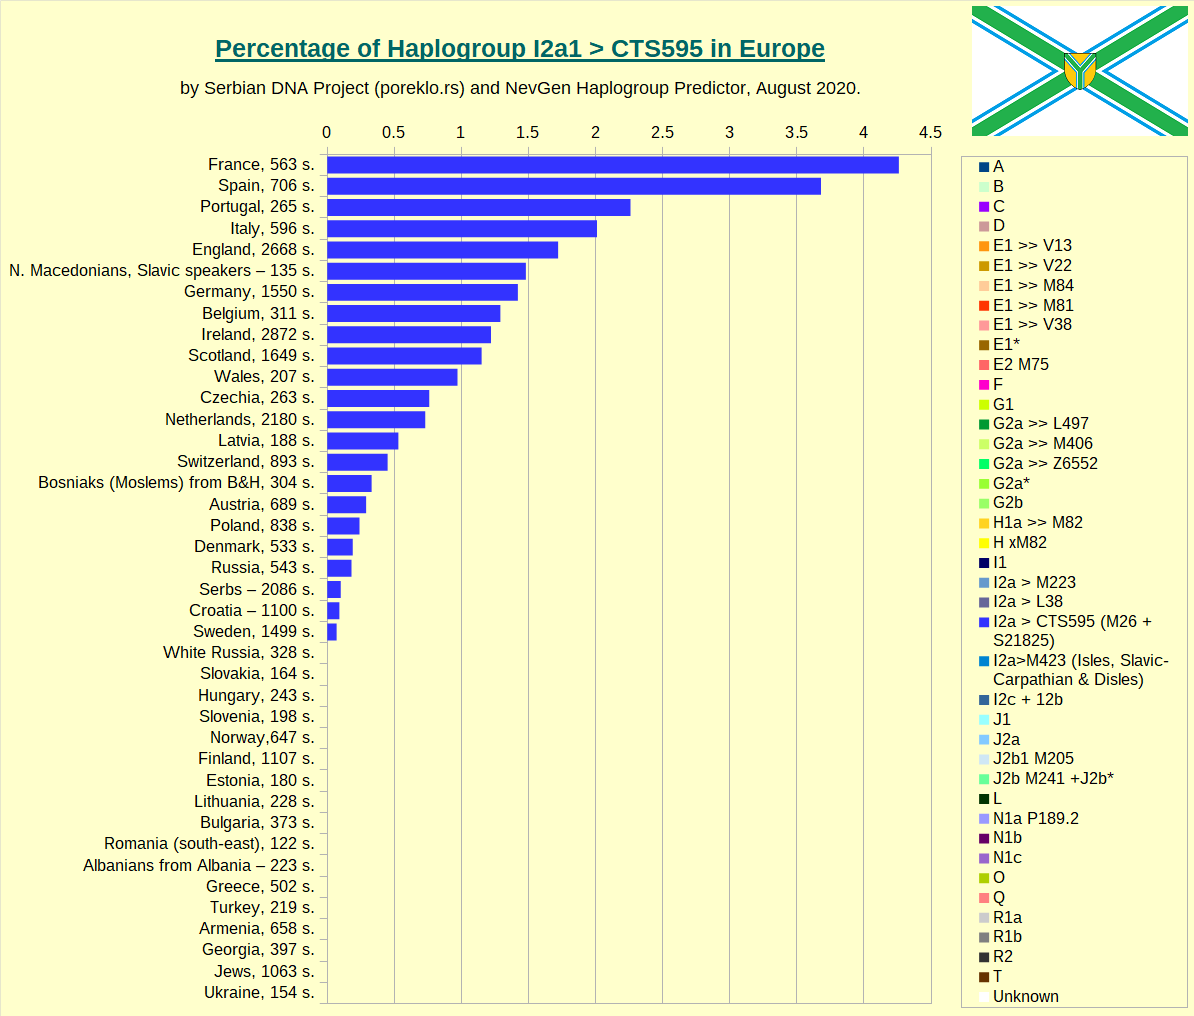
Haplogroup I2a1 > CTS595 in Europe. It contains M26 (better known as "Sardinian branch", although it's place of origin is not Sardinia, it is just place with biggest concentration), L233, and few smaller subclades.
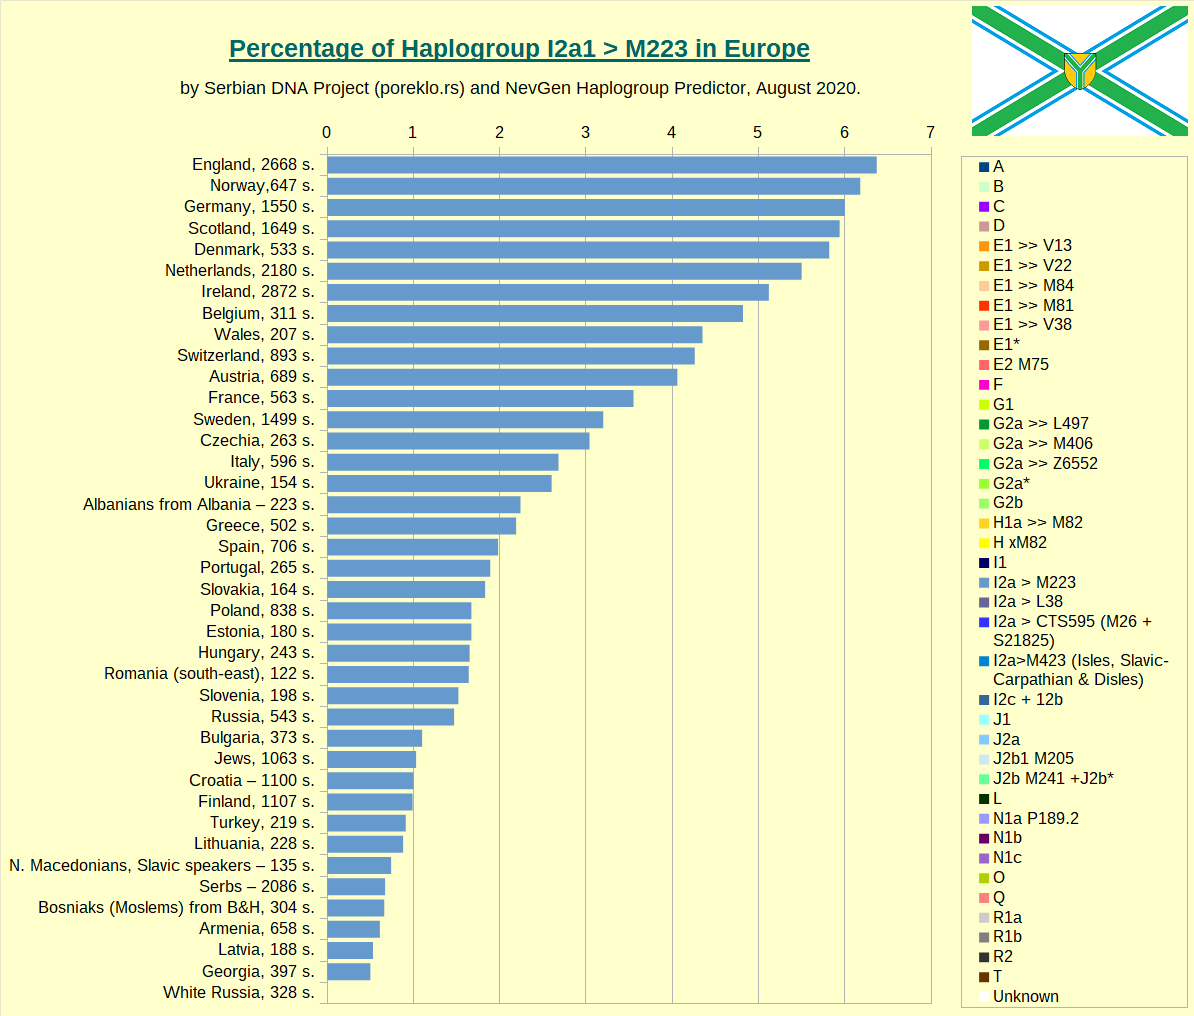
Haplogroup I2a1 >> M223 in Europe.
Haplogroup I2a1 >> M423 in Europe. Beside several small subclades, it contains L161 (mostly British Isles), Disles (British Isles again) and Slavic-Carpathian branch CTS10228, with greatest concentration in slavic-speaking countries.
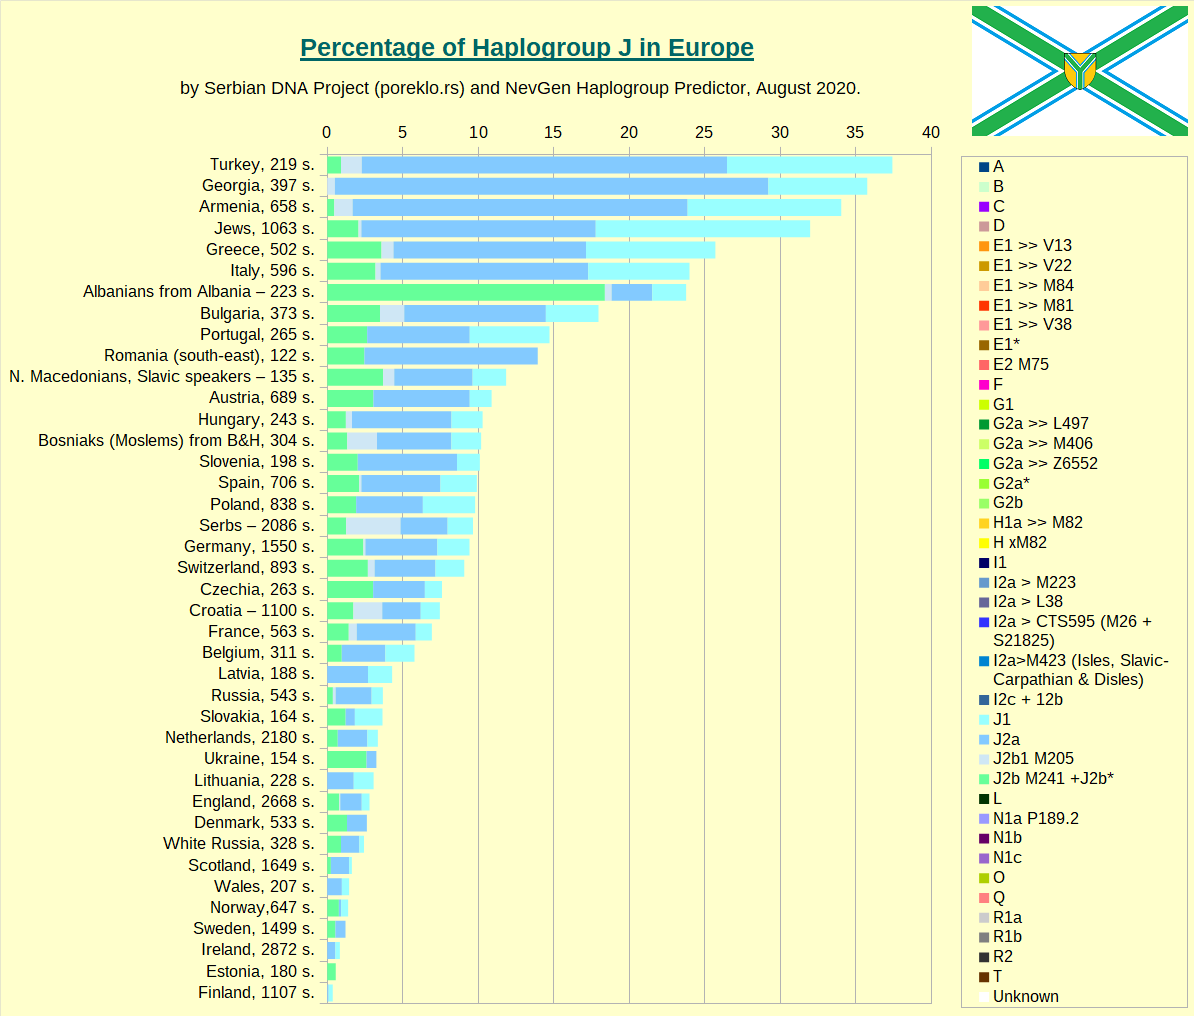
Haplogroup J in Europe, taken as whole.
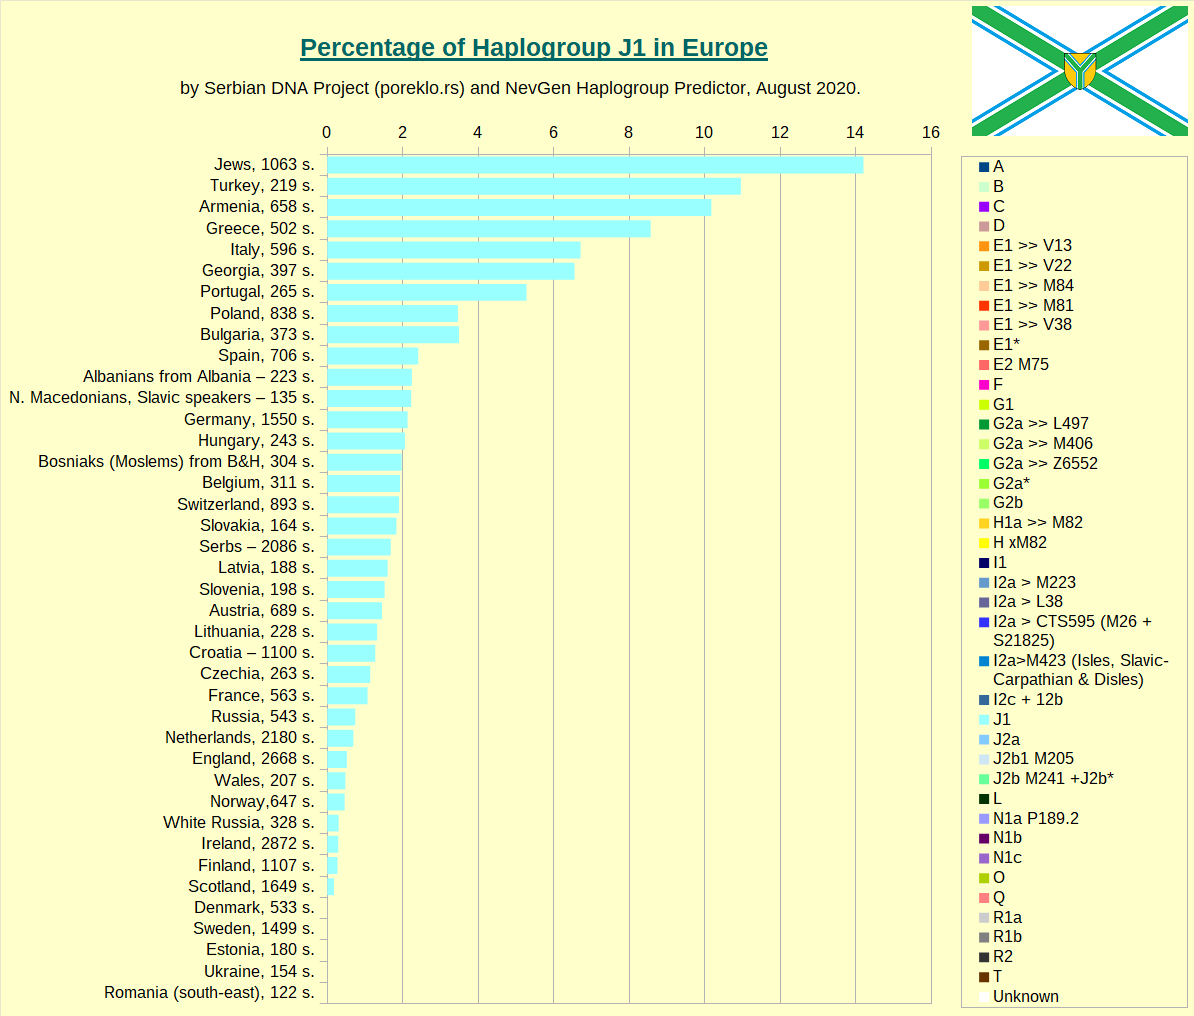
Haplogroup J1 in Europe.
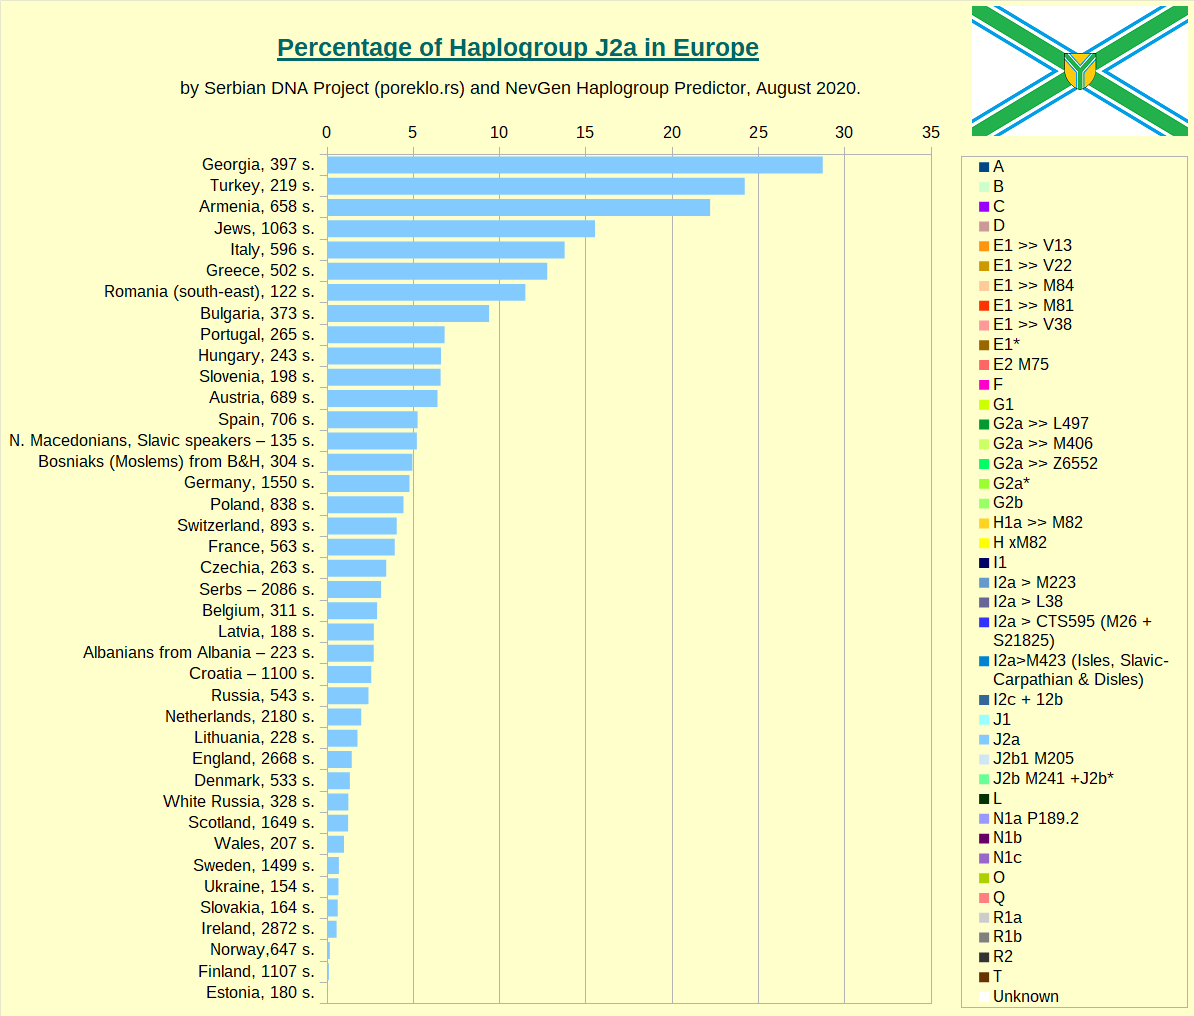
Haplogroup J2a in Europe.
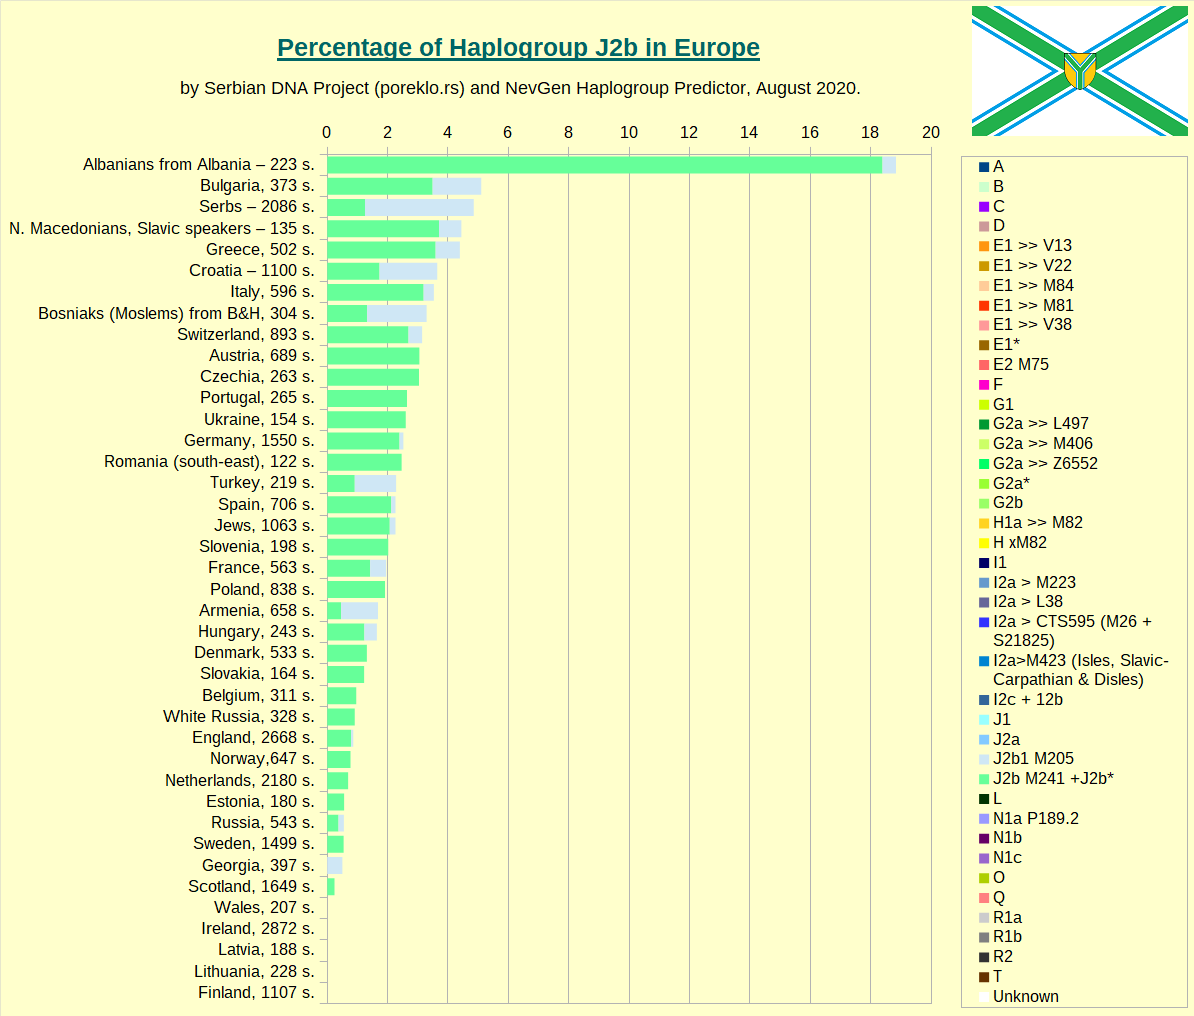
Haplogroup J2b in Europe.
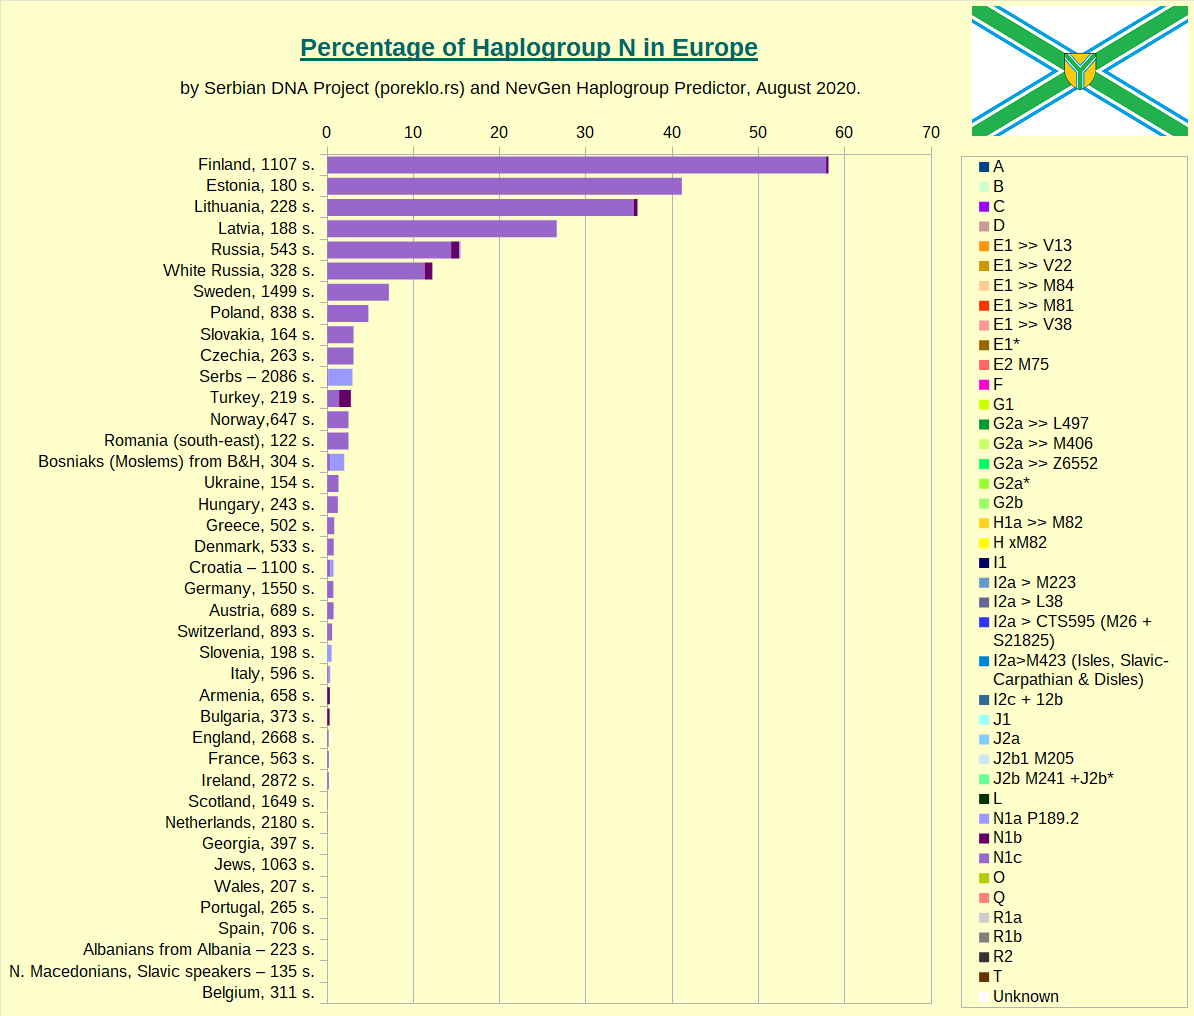
Haplogroup N in Europe.
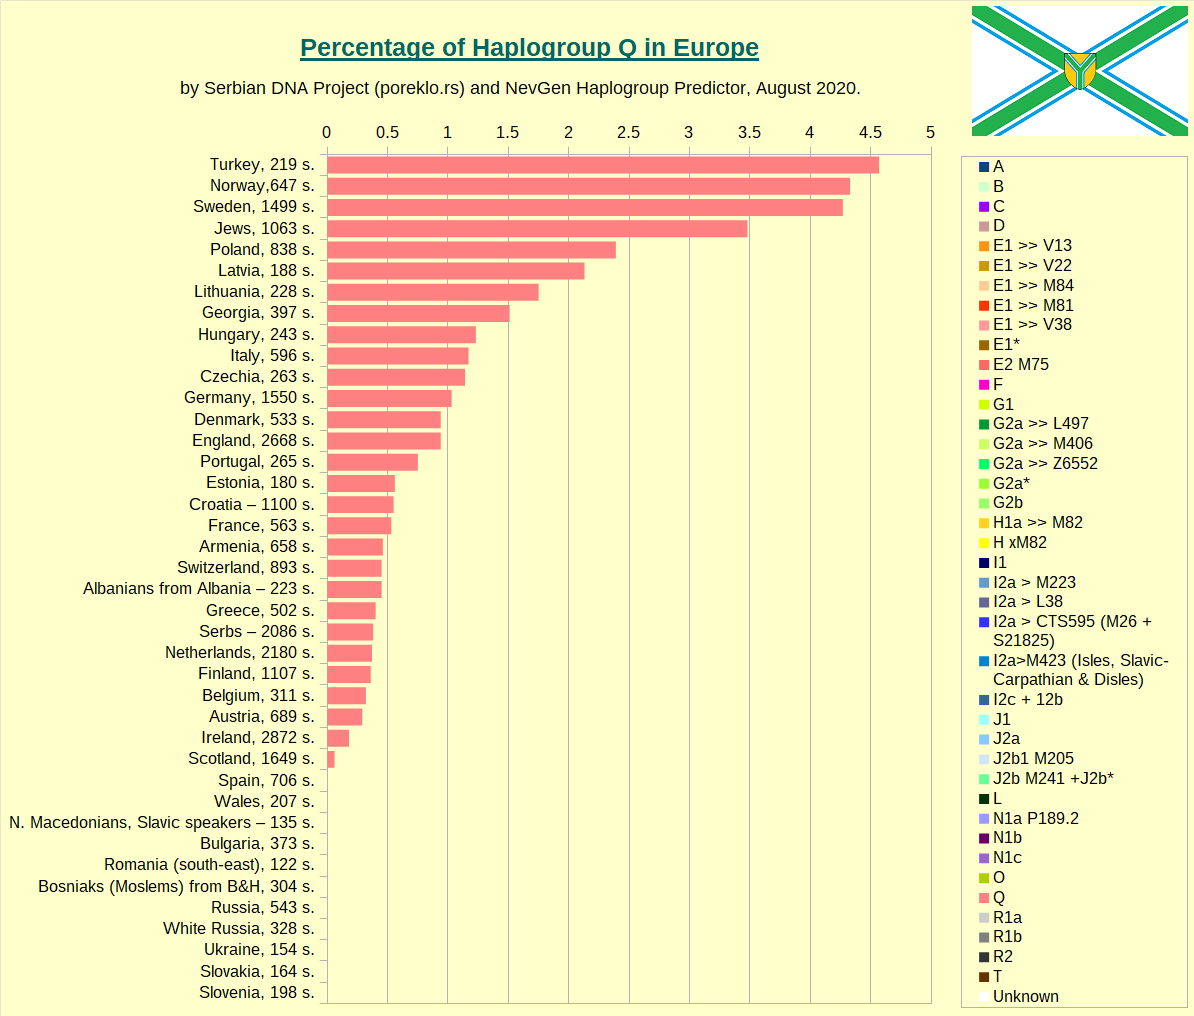
Haplogroup Q in Europe.
Haplogroup R1a in Europe.
Haplogroup R1b in Europe.