About NevGen haplogroup predictor
First version of NevGen predictor was made in May of 2014. In that time it was available only as desktop application (and its existence was known only to small number of people in Serbia), and contained only part of today available subclades. Gradually during next two years many new subclades have been added, many existing subclades have been divided into its deeper subclades, several changes in its underlying mathematics were made, and finally, at the end of year 2015, internet edition has been made called "www.nevgen.org", whose functionality to some smaller degree is subset of functionality of desktop edition.
Inspiration for NevGen Y DNA Predictor in that time came from excellent and legendary Athey's Haplogroup Predictor, well known in Genetic Genealogy Community and probably the most famous one. Calculation of fitness in first version of NevGen was done in the same way Athey described underlying mathematics of his predictor here and here. Like Athey's work, NevGen also uses Bayesian-Allele-Frequency Approach in predicting to which haplogroup a Y STR haplotype belongs to.
One of differences between NevGen's and Athey's predictor's working (according to how Athey described it, I never saw his code) is usage of correlation (interdependence) of values of different STRs during calculation of probabilities of subclades. Athey did mention the possibility to use correlations of STR values to improve results, but I believe he never implemented it.
In NevGen it is implemented. NevGen uses correlations between values of pairs of STRs. In future it might be extended to triples or more of STRs, but for now are only correlations of pairs used. NevGen uses both negative and positive correlations, but negative have priority over positive ones, because they are less prone and more resilient than positives to deviations resulting from unbalanced haplotype sets representing subclades (which is mostly the case with available data).
Here I shall not describe Bayesian-Allele-Frequency Approach nor calculation of fitness in earlier version, because both are well described in Athey's description of his Predictor. But, I shall describe correlations of pairs of STR markers through one example, and its use during calculation of probabilities.
In haplogroup J1a2a1a2 P58>FGC11, let examine markers and their alleles DYS 460 = 11.0 and DYS 487 = 13.0. DYS 460 in my samples for FGC11 is present in 599 of them, in 221 of them it has value 11, which makes its frequency is 0.369. DYS 487 is present also in 599 samples, in 338 of them it has value 13, so its frequency is 338/599 = 0.564. If we assume that marker independence exists in HG J1>FGC11, we should expect that both values DYS 460 = 11.0 and DYS 487 = 13.0 exist in 0.369 * 0.564 * 599 = 124.705 haplotypes. But, it is not the case, both such values exist only in 16 haplotypes. So, we here have negative correlation of two values, which actually decreases possibility that haplotype with DYS 460 = 11.0 and DYS 487 = 13.0 belongs to HG J1>FGC11. So, when NevGen predictor gets haplotype with those two values, it will in assessment that it belongs to HG J1>FGC11, in calculation use percentage of both values happening in J1>FGC11 samples (16/599), rather than simple product of both allele frequencies (221/599 * 331/599).
Calculation with assumed STR marker independence is straightforward, it can be done only one way, it is simple multiplication of frequencies of every STR value of given haplotype in given subclade (or actually summation of its natural logarithms). With correlations of values of STR markers it is not that simple. Since the same value of any STR (for example DYS 460 = 11.0) can be correlated differently with many values of many other STR markers, predictor must decide which of them to use, and which not. NevGen predictor, for now, uses at most two of them for every STR marker (in future it might change). So, it must somehow sort them in order of "goodness". Like I have writed before, it gives advantage to negative rather than to positive correlations. Inside both groups it has rather complicated rules of assessing which one is better, figured out after a lot of testing, which might change in future if we find logic which has better score of guessing haplogroup of samples with already known subclade.
In many cases correlation of values is not needed. We do not need it to distinguish R1b haplotype from E1b1b-V13 or from some J2b2-M241 haplotype, even on first six markers. In fact, experienced genetic genealogist do not even need predictor for that, it is obvious to him on sight. But, in some cases use of correlations can greatly improve chances for predictor to make good prediction. From my experience in some cases on 17 markers it can be hard to distinguish some I1 from some G2a haplotypes, or some C2 from some I2a1b Isles haplotypes. In such cases, correlations may help.
During preparation of R1b level on NevGen, which was released on April 29th 2016, deep testings of its accuracy were conducted, on different number of markers (12, 25, 37, 67 and 111), both with and without use of correlations. Here I shall explain how it was done and its results, both with and without use of correlations.
First, R1b level has been divided on 168 subclades (unfortunately, list is not complete, because many subclades has too few haplotypes to be present in NevGen predictor, and many haplotypes are marked with *, meaning they do not fit into any known subclade of its immediate parent clade). Sample haplotypes used during testing of accuracy of NevGen are derived from all available sample haplotypes used for R1b level creation, their number ranging from 5766 for at least 12 markers to 3263 on 111 markers. From original known haplotypes, samples used for predictor testing are made by artificially and randomly changing them through 40 generations (like it is happening in nature), using Marko Heinila's STR mutation rates. For every original haplotype with known subclade (confirmed with SNP) 10 such random independent 40-generations-deep descendants were made, and they were used to test NevGen's accuracy. One of reasons for use of artificial descendants for testing is to make job to predictor harder by deviating original haplotypes from which it was made. In this way results of testing are more realistic for haplotypes which did not come into original set of sample haplotypes. To be considered as correct hit, predictor has to give for every testing haplotype at least 80% of probability to its already known subclade. And here are results for every used number of markers during testing, both with and without use of correlations:
111 markers - 97.94% (92.87% without use of correlations), on 3263*10 artificial 40-gen-deep samples.
67 markers - 89.19% (77.22% without use of correlations), on 5109*10 artificial 40-gen-deep samples.
37 markers - 72.46% (53.50% without use of correlations), on 5669*10 artificial 40-gen-deep samples.
25 markers - 48.85% (31.04% without use of correlations), on 5690*10 artificial 40-gen-deep samples.
12 markers - 18.76% (11.83% without use of correlations), on 5766*10 artificial 40-gen-deep samples.
From these results can be seen that with use of correlations accuracy of NevGen predictor is considerably increased. Another reason for using 40-generations-deep descendants in testing is to make assessment how will predictor behave for haplotypes which have MRCA with some of samples used for predictors's statistics of up to 40/2 = 20 generations, which is up to 20*30 years = 600 years to TMRCA. Such descendants are some kind of approximate substitution for haplotypes with 20 generations to MRCA with existing original samples, except they are more distant from ancestral haplotype of the whole subclade.
When original haplotypes used for NevGen's statistics are used for testing, accuracy is greater (for example, on 67 markers it is 97.46%, comparing to 89.19%), but such results are neither relevant nor realistic for unknown haplotypes since predictor is biased towards its original subclade.
NOTE on previous statistics: it was done in April 2016, before intoduction of probability of unsupported subclades into calculation. After it was done, some probability in many cases goes to "unsupported subclades", which decreases probabilities that go to original subclades. Here is not displayed statistics which includes unsupported subclades because calculation of it has to be finer tuned in next period. Now introduction of probability of unsupported subclades in calculation shows very marginal impact on accuracy of NevGen predictor for haplotypes already known which subclade they belong to, for example on 111 markers it now scored 97.71% (compared to 97.94% earlier). After fine tuning would be done, it is expected to be even less.
For creating distribution statistics of alleles for different STR markers and subclades, in NevGen are used Marko Heinila's mutation rates (you can see smoothed statistics in picture generated in NevGen for entered haplotype). They are used to 'smooth' distributions of frequencies of alleles on STR markers, making them to be more realistic, which improves accuracy of predictor. It is especially necessary for subclades with small number of available sample haplotypes. Without smoothing, predictor would be considerably biased towards subclades with more samples and against subclades with less samples. With use of distribution smoothing bias is considerably decreased. Smoothing is the reason why in generated charts could be found some percentage for some alleles when there are no such alleles in available sample haplotype data (experienced genetic genealogist might notice that).
Haplotype data used for NevGen predictor comes from different public FTDNA projects, as they are the best and most complete source that could be found on internet. For predictor's statistics are used only 'green' haplotypes (those confirmed with SNPs). 'Reds' (unconfirmed) are ignored. Even not all of 'green' haplotypes are used. Those who are not sufficiently deep SNP-tested are also not taken into account, for example, haplotypes for R1b level with only M269 or L21 confirmed.
For some typically Asian haplogroups like H and D available data is scarce, and/or insufficiently deep classified into subclades. The same goes for A and B and subbranches of E typical only for Sub-Saharan Africa. Because of that, NevGen predictor is not much usable for them, or at best not as good for predicting them as it is for typically European or Near Eastern haplogroups. For haplogroups M and S NevGen has no means to predict them, because no usable haplotype data for them is available. For haplogroups C and O available data is a bit better than for H and D, but that is still not enough their quality to be comparable to haplogroups from Western Eurasia. Our advice is, do not use NevGen for haplotypes (especially short ones) originating far from Europe, for example from Subsaharan Africa, East Asia, Oceania or Indian subcontinent.
False positives
Bayesian approach which NevGen predictor uses has one bad property, or problem: it assumes that entered haplotype belongs to one of subbranches supported by predictor. So it divides 100% of probability to its supported haplogroups. But this assumption need not be true in every case. No predictor is complete, it does not support every known haplogroup or subbranch. Beside that, user can freely enter any figured-out haplotype, or even random numbers. Even in such cases predictor would give 100% to some of its haplogroups or subbranches, or divide it among several of them. This bad property and biggest NevGen's weakness till June 11th 2016, is called "False Positive". Adding new subclades would lower such problems but not solve them completely. For example, R1b level currently supports 168 subclades, but there are some R1b haplotypes that do not belong to any of them. If they were predicted with NevGen prior to June 11th 2016, they would had been FALSE positives, some of predictor's supported subclades will divide 100% of probability among themselves. The same was with R1a, I1, J1, J2a and all other haplogroups.
Till June 11th 2016, the only way to defend us from such false positives was to look at Fitness score. If it looked too small (for example 12%), it was most probably false positive. In R1b level, most of haplotypes which gave fitness score less than 75 would have been false positives. But, in that time we didn't had good criteria to tell apart false positives from good predictions.
After first two editions of NevGen, we have had some ideas how to make new and better Fitness scores and by them improve NevGen and ease recognition of false positives. And we implemented them. First, new statistics (calculated from Fitness scores) was added to NevGen Predictor with purpose of giving some estimate that entered haplotype does not belong to any of supported subclades. Now NevGen does not need to distribute 100% of probability to supported subclades, some part of it could be given to "unsupported subclades", which is big step toward salvation from "False positives" problem. For example, during testing we tested R1b level with several R1a haplotypes with 67 or 111 markers. In all cases, it gave all 100% to "unsupported subclades" and consequently 0% to supported R1b subclades. As was expected. Something must be highlighted here: probability of unsupported subclades is not calculated for haplotypes less than 37 markers long. So, for shorter haplotypes "False positive" problem still exists in its full measure.
Another thing we have done in edition of June 11th 2016 is replacing of older Athey-style Fitness with newer one, based on unbalanced probability score. Since calculation of probability of unsupported subclades is based on Fitness, during mass-testing New Fitness showed much more effective than older one, Athey-style Fitness. So, older one was completely replaced. New Fitness based on probability has considerably lower average value than older one, and it never can be 100%, unlike older one.
Another Fitness added in June 2016 is "Relative Fitness" (Fitness 2), and it is statistics that compares fitness of entered haplotype with average fitness of haplotypes on which was made statistics for given subclade. If haplotype has Relative Fitness greater than 1, it means that it fits better into subclade than average haplotype known to belong to it and used for it's statistics. It is also calculated only for haplotypes with at least 37 markers.
Because of False positives, but also because of 'haplotype convergence' (please see http://isogg.org/wiki/Convergence), our advice to users is to be very cautious and do not blindly trust NevGen Predictor too much, especially in three cases:
1) when number of markers is low (for example 12, or 9).
2) When Fitness score, or Relative Fitness score is low. Low limit for Fitness depends of subclade, for older (like E1a or C2) lower fitness could be good, for example Fitness of 25, but for younger (like R1b DF95) even fitness of 60 could signal false positive. Also, if Relative Fitness (Fitness 2) goes beneath 0.8, it also might signal false positive.
3) when trying to distinguish between very close subclades, like western R1b (under P312).
In no case we guarantee predictions of NevGen nor we take responsibility for any damage from it. NevGen's predictions are provided "as they are" with no expressed or implied warranty. The authors accept no liability for any damage, in any form, caused by NevGen usage. You use it at your own risk. It has been tested but we are not perfect programmers, nor is data on which NevGen predictor was built.
Priority in Athey's predictor. Why there is no such thing in NevGen?
In Athey's haplogroup predictor there is list box when user can select one of several areas: "Northwest Europe", "South Europe", "East Europe", and others. Its effect on calculation of probability of some subclade is multiplying already multiplied frequencies of given haplotype's alleles in subclade with subclade's frequency in chosen area, before they are normalised with sum of them all. In NevGen there is no such thing, because of two reasons. First, NevGen across several of its levels have hundreds of subclades. For such number of them, how could be made any reasonable assessment of its frequencies in any part of Eurasia (for example, think only about N1a, R1a YP1051 or E1a, how to find out their percentages in any part of the World)? Another reason for no attempt to include Priority in NevGen is varying frequency in different populations or subregions even in some small part of the World. For example, J2b2-M241 is found in northern half of Albania at frequency of 25%. In neighbouring Serbs it has frequency of less than 1.5%. On the other hand, haplogroup I2a1b-Din is found in Serbs at 37% (according to Eupedia), but is found in northern half of Albania and in ethnic Albanians in Macedonia and southern Serbia (Kosovo and Metohia province) at only 2.5%. With such in-region differences, it seems nearly impossible to make any decent Priority model for NevGen predictor.
Incomplete values
Incomplete values (like 18.2, 24.3, 15.1 and such) are not supported in Internet version. Reason is simple: lists (one for every STR marker) does not have incomplete values in their contents, because it could be too heavy burden. Desktop edition of NevGen (not available on internet) does have support for incomplete values in its structures, code and data, and uses them because it does not work with lists for STR values. But, it has them in STR frequency statistics only for three STRs and three haplogroups (.2 for J1 subclades on DYS458, .3 on DYS390 for N1a and .2 on DYS385a for several haplotypes in I2a2-L38). Incomplete values could be great to ease haplogroup determination, but problem with them is that they are not easily recognized in public haplotype data. FTDNA projects does not display them, except in some cases in rows with MAX and MIN values for sections. In most cases that is not enough to establish where they could be found. That is pity, because they could greatly enhance haplogroup prediction.
Advice (especially for haplotypes from J1 haplogroup): when entering haplotypes into NevGen Edit field please remove all uncomplete values. Using them shall lower Fitness scores and probability!
R1b level of NevGen
R1b is among all Y DNA haplogroups probably the most difficult to predict its deep subclades. Its hardness comes from its relatively recent burst and almost unhindered spreading. Other haplogroups and their subclades had experienced many bottlenecks, due to living conditions of their carriers, which resulted in more differences between their modal haplotypes and their STR alleles frequency statistics, which eases their recognition. With R1b, especially with "western" R1b (under P312) it is much less the case.
After failure of first attempt of division of R1b, where we foolishly and without much thinking of it tried to divide it only into several first-level subclades (like U106, L21, DF27, U152 ...) we realised that this approach that worked well with other haplogroups with R1b will not do. We realised that only dividing of R1b into much deeper subclades might give something that works decent. And that way was made NevGen's level for R1b subclades, with 168 subclades (for now; there will be more added in not so distant future). Thousands of R1b haplotypes with deeper SNPs were collected from many FTDNA R1b projects and divided into many subclades. After through testing it seemed this works decently with available haplotypes that really belong to some of supported subclades. But, it still has some weaknesses, and I shall not be hiding them. And user should keep in mind that R1b Level is still experimental, and that much of work still has to be done.
-Many of supported subclades has too few sample haplotypes on which they are built. 44 out of 168 subclades has only 10 or less samples (but none has less than 5, it is our minimal needed number for making of subclade of R1b). That makes their statistics less accurate and reliable. We had two choices, to include them or not to include them and let their haplotypes be candidates for another FALSE positives. So decision was made to include them, which we thought is lesser evil. I hope in future will be more available samples, and we shall update NevGen predictor from time to time with adding new samples into their subclades, especially those with small number of haplotypes, which shall make them better.
-Another big weakness of NevGen's R1b level is the fact that majority of its available sample haplotypes are descended from British Isles. Even some subclades under U152 has British Isles majority in samples, contrary to the fact that U152 is more typical for Southern Europe, especially Italy, than it is frequent in British Isles. Another example, R1b is not less frequent in Portugal than it is in Great Britain, but it has tens of times less available samples (and even they are with poorer quality, with less STRs in average comparing to samples from British Isles). This fact makes NevGen's R1b level biased towards British Isles. Haplotypes from British Isles will have more chance to give positive results than haplotypes with origins in other parts of Europe. Haplotypes originally outside of British Isles, even if their subclade is available and right predicted, will usually have less of fitness than haplotypes from B.I.
There is (for now at least) nothing we can do to lower bias towards B.I, if we somehow filter those samples from B.I. and decrease their numbers we would cripple predictor and make more bad than good. I hope there will be in future more haplotypes from other parts of Europe, especially Southern Europe and from France.
-Insufficiently divided subclades. Because of scarcity of available data, we were unable to divide several R1b clades into deeper subclades, which may have negative influence on quality of predictions. That is especialy true for subclades of U152, (for example most problematic there are Z36 and L20 clades, where for most of their haplotypes is not known into which of their subclades they belong), and also some clades under L21>DF13 (FGC5494, CTS1751) and P312>DF99. As soon as more appropriate data is available, they will be divided into deeper subclades.
R1a level of NevGen
R1a level for NevGen is added on June 11th 2016, more than 40 days after its brother subclade R1b. For now it has 71 subclade. Testings showed something people in GG already knew, that R1a deep subclades are much easier to predict than subclades of R1b. R1a level suffers even more than R1b level from low number of haplotypes for some of its subclades. Here there are two subclades with only 4 samples. In future will be added new samples to subclades, as they become available. And more subclades, ofcourse.
Unfortunately, statistics for R1a subranches under Z93 (mainly from Indian subcontinent, Near East and Western and Central Asia) are not so good as are statistics for typically european subclades, because haplotype data for them is less numerous and less deep SNP defined. That is reason why is NevGen more confident for european subbranches than for asian.
Plans for future
We plan to add in future many new subclades to some other haplogroups, like J, I, E, and some others. In future we might make deep separate levels for other haplogroups, like it is for R1b and R1a. This description of NevGen predictor and manual will be also updated from time to time.
First edition of this description writen on June 12th, 2016, last update on July 26th, 2016.
NevGen's coefficients of fitting of subclade into another subclade
(last updated on January 10th, 2018.)
Experienced genetic genealogists know that haplotypes of some subclades are relatively easy to be confidently predicted on some set of markers. For example, haplotypes belonging to R1b subclades L226 and M222 are easily recognisable even on 37 markers, and accordingly haplotypes of those two subclades are easy to distinguish from haplotypes of any other R1b subclades. But it is well known fact that in general R1b subclades are not easy to distinguish on 67 or often even with 111 markers. Already is also known fact that in general R1a subclades are easier to distinguish (to be predicted) than R1b subclades on any set of markers.
We tried to formalize relation of "similarity" (or it's inverse, "distinguishability") of two clades on any set of markers in NevGen predictor. Or, in other words, to calculate some coefficient which measures NevGen's capability to distinguish one clade from another on any predefined set of markers. Code for it was designed in August 2017. Result of it is numerical measurement named "fitting coefficient of Subclade A into statistics of Subclade B". First thing needed to note here is that this is not simetric: fitting of Subclade A into Subclade B is not the same thing as fitting of Subclade B into Subclade A. Fitting coefficient measures how average representative of Subclade A fitts into statistics of Subclade B. If it fitts more, than Subclade A is harder to distinguish from Subclade B. So, predictor can give more reliable predictions if fitting coefficients are lower.
Now we shall try to explain how fitting coefficient of Subclade A into Subclade B is calculated. Haplotypes used for it are all those available in training data set for each subclade which contain predefined set of markers, but they are previously distorted by randomly changing them through 20 generations (this way we get artificial descendants, several of them for each original haplotype). This way we get greater fitting coefficients which are more realistic for unknown haplotypes, those which are not part of our training data set. For all such distorted haplotypes of both subclades A and B we calculate fitness scores into statistics of Subclade B.
Then for every used haplotype from Subclade A we find percentage of used haplotypes from Subclade B which has lower fitness score into statistics of Subclade B. We find average of such percentages for all used haplotypes from Subclade A, multiply it with 2, and what we get is final fitting coefficient of Subclade A into statistics of Subclade B, in range [0, 1]. This kind of calculation is maybe not the most scientific, but it is simple and easy for implementation and understanding.
Now let see some samples, with fitness scores distribution in range from 0 to 100. First goes fitting of R1a haplotypes into R1b statistics in NevGen's General Levels (from R1a and R1b are excluded some very old subclades, like YP4141, YP1272, V88, V1636, PH155... which does not change results much), together with fitting coefficients. We can see it on six different markers sets.


As we can see from five FTDNA marker sets, more markers means lower fitting coefficients, which means greater discrimination power. As is expected. On first four markers sets (up to 37 markers), there is small overlapping of fitness scores of R1a and R1b samples into R1b statistics. It diminishes on 67 and 111 markers.

I1 fitts less than R1a into statistics of R1b, it's fitting coefficient is 0. Again as expected, since it is more far away in time from it than R1a is.

Now we have two deep subclades of R1b > M222, with very high fitting coefficient on 67 markers set. On picture we can see that two of it much overlap, so it is hard to distinguish among them. Generally, it is very hard to distinguish among subclades of M222. Experimental Level was made only for M222, with 46 subclades (some of them are parasubclades, like DF85, DF97, S568...), based on about 450 haplotypes. Results are not satisfying, and average fitting coefficients are 0.1328 for 67 markers, and 0.05847 for 111 markers, which is very high. Many more deep SNP defined haplotypes are needed in order predictions of subclades of M222 to be reliable. It is reason why this M222 Level is not available.

Although subclade U106 > S6989 is of similar age like subclade M222, subclades of S6989 are much easier to differentiate than subclades of M222. We can see here one example of it, with much lower fitting coefficient on the same set of markers.
Fitting coefficients highly depend of NevGen's algorythm and parameters, but also depend on division of haplotypes into subclades. With division of available haplotypes into more subclades it is expected fitting coefficients to be lower in average, which makes prediction more reliable. Also should be noted that fitting coefficients are calculated on basis of known haplotypes. We do not know how shall behave unknown haplotypes which could be very far from all to us known haplotypes which belong to the same subclade.
Here can be downloaded tables of fitting coefficients, for all levels available in predictor. This shall be refreshed from time to time. We need only to describe what columns mean. This is short sample from statistics on 67 markers of one of subsections in Level R1b.

We see here part of subsection for subclade PH1639. First column is nothing more than ordinal number of other subclade in level. Second column (in brackets, data is ordered by it) holds fitting coefficient of subclade named in row into subclade in subsection, for example first row says that fitting coefficient of subclade BY3293 into statistics of PH1639 is 0.0173 (in table it is given in percentages). Third column holds opposite fitting coefficient, in the same row it is fitting coefficient 0.0431 of PH1639 into statistics of subclade BY3293. Fourth column is just average of second and third column. At the end of subsection (which is here for simplicity shortened to just first four rows) we have averages of all three coefficients.
News about NevGen updates
-June 19th, 2016. I2a1b L621 Disles & Dinaric has been divided into 11 subclades on level for longer haplotypes. Since Dinaric's TMRCA is at most 2500 years, its haplotypes are very close to each other and this division may be called experimental. Data for Disles (without Dinarics, which are its biggest subbranch) are very scarse, so statistics for new Disles subbranch is not very confident.
-June 28th, 2016. I1-P109 and I1-L258 have been divided into 12 and 5 deeper subclades on level for longer haplotypes.
-July 8th, 2016. Division of E1b1b for longer haplotypes has been revised. Subbranch E-V13 is now divided into 12 deeper subbranches, E-M123 into 6, and so on. Some of those are made on small number of samples, so they might be not too confident. There are now also two subclades, E-PF1975 and E-Z1515, which were not present in NevGen till now. Several days before E-V65 subclade had been added.
-July 31st, 2016. Very complex haplogroup J2a has been revised on both levels. Instead of former 13 subclades on level for longer haplotypes, now it is divided into 35 subclades. Most of them are got by division of existing subclades, but there are also two which previously were not supported. That are J2a1 Z1846> Y8378 and J2a1 PF5087> Z7430. Both of them are made on small number of haplotypes (less than ten), so they might not be too confident. Some others also have small number of haplotypes on which they are based.
-August 20th, 2016. The earliest haplogroups A00 and A0a which first branched away from the most of other people have been added to Nevgen's level for longer haplotypes. Both are made on very small number of available haplotypes (2 and 4), so they might be called experimental. In R1b level several small subclades under U152 have been added (but since they are based on small number of haplotypes they are not too confident). Also, two subclades under U152 (L20 and Z36) and Z209 under DF27 have been revised and partially divided into several subclades.
-September 9th, 2016. In R1b level several subclades have been divided into their's deeper subclades, for example P312>>Z17112, U106>>L44, U152>L2>>Z150, L51>>CTS4528, and several more. Till now the most problematic subclade in whole R1b level was U152>Z36, where majority of available haplotypes were not known to which further subclade they belong. Since those are very diverse (Z36 is estimated on YFull to be 4500 years old), statistics of Z36 (minus its known subclades) was too wide and in prediction drew many non Z36 haplotypes to itself (0.3% of them during testing). In order to solve this problem, we have to divide it into several nameless clusters, using our own treemaker application on all Z36 haplotypes with at least 67 markers. And, this way remnant Z36 haplotypes have been divided into 5 clusters. Now they do not have such bad effect during testing. R1b level now has 227 subclades, and in mass testing (described earlier in this article) now has score of 92.14% on 67 markers (in April it was 89.19%).
-September 15th, 2016. Subclade G2a2a PF3147>> M286 has been added into level for longer haplotypes, with help of Boed Marres, administrator of G2a PF3147 project.
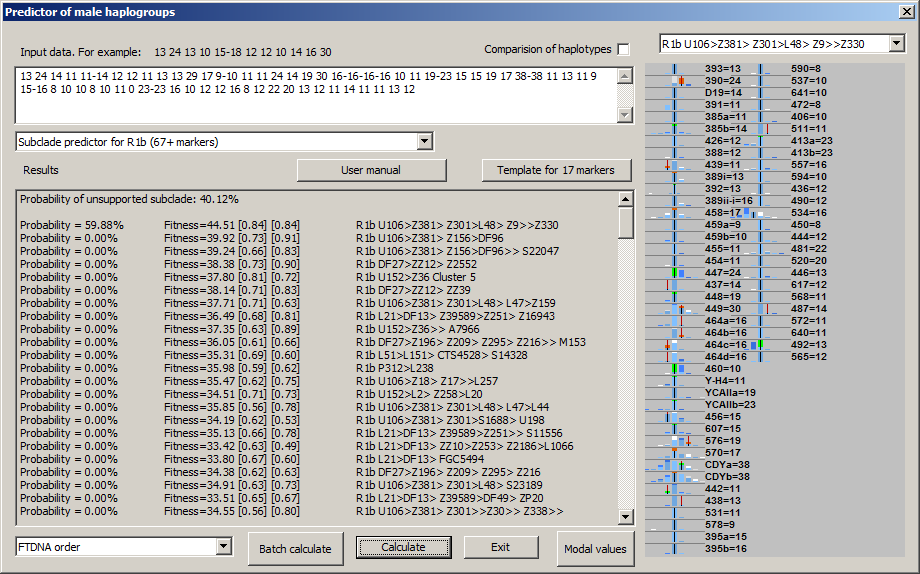
-September 23th, 2016. We released upgrade of generated picture in NevGen, which will make it more informative and usable. For now, upgrade is available only to levels for R1a and R1b, but in near future it will be available for other two general levels.
Picture now contains means to compare statistics of deeper subclade (in sample picture it is R1b U106>Z381> Z301>L48> Z9>>Z330 and super clade (it is statistics of whole R1b in this sample). Picture now displays both statistics in different colours. Sample picture above shows display from desktop edition of NevGen, which is not available in public.
To understand meaning and purpose of new feature the small introduction is needed. In this sample is about R1b, where goal is to predict deeper R1b subclade to which sample haplotype belongs. To determine does 67-marker haplotype belongs to R1b is not hard task. But to determine deeper subclade is much harder task, and in many cases not solvable with confidence without SNP testing.
One of approaches usually used by administrators of various FTDNA projects and experienced genetic genealogists is something like this:
Administrator knows which STR values are common (modal) for whole of R1b (for example it is 25 for DYS447 and 11 for DYS460). Administrator of R1b U106 also knows that for example subclade
R1b U106>Z381> Z301>L48> Z9>>Z330 has common values for two STRs different than are for whole R1b, it is 24 for DYS447 (not 25) and 10 for DYS460 (instead of 11). And, if admin finds haplotype which has those two values which are specific for R1b >> Z330 (and maybe other such STR values, like DYS492=13, which is characteristic for all U106), he even without SNP can be pretty shure that haplotype belongs to this subclade. This is probably the most used strategy for predicting of deeper subclades, by comparing of specific (nonmodal) STR values of haplotype with STR values known to be characteristic for some subclade. But, it is not easy thing to keep in mind characteristic STR values for hundreds of deep subclades.
New changes in NevGen generated picture are designed for such task. Here on sample picture we have sample haplotype known to belongs to R1b U106 >> L48 (but no deeper SNP is known), where are drawn statistics for deep subclade (with white colour, it is here first in the list left, it is R1b U106>Z381> Z301>L48> Z9>>Z330) and also statistics of superclade (with saturated blue, it is whole R1b). Where two statistics overlap (which is mostly the case) is drawn with lighter blue (which is in fact mixture of white and blue). On picture you can easily recognise which values are typical for deep subclade but not for whole R1b (those are drawn as white or green columns). Deep blue or orange columns show values which are typical for whole R1b but not for deep subclade. Green parts of columns mark characteristic values of deep subclade that are shared with haplotype (haplotype has them). Conversely, orange parts of columns mark typical values of whole R1b (but not deep subclade) that are shared with haplotype. It is obvious, as there is more greeness and less orangeness on picture, it is more probable that haplotype belongs to deep subclade (it fitts better), and vice versa. In other words, more of green means haplotype has more STR values that are characteristic for deep subclade but not for its superclade.
On basis of this in desktop edition of NevGen has already been made new experimental, third fitness score (you can see it on picture next to other two). I hope it will one day be present on internet edition too, if it shows useful.
Two days after, this became available in NevGen general level for longer haplotypes. Here it is applied in several major haplogroups, like E1b1b, Q>M346, I1, I2a2-M223, J1, J2a and several more. Statistics of its subclades is compared with statistics of whole it's superclade. But, there are several exceptions, subclades of E1b1b-V13 are compared against statistics of V13 (not all of E1b1b), and the same goes for subclades of E1b1b-M123 and I1-P109.
-October 16th, 2016. Haplogroup J1 has been revised. Many of previous J1 subclades in NevGen have been divided into deeper subclades, especially FGC11 and YSC76, and several subclades were added which were not supported before. Instead of 12, NevGen now supports 59 J1 subclades.
-November 13th, 2016. Very old basal subclade M73 of R1b has been added to NevGen predictor, which can be found mostly in Central Asia, Western Asia and Pakistan, with also few representives across Europe. Also many new samples have been added for statistics of R1b U152 and R1b U106, and some of their subclades have been further divided, so they should now be more reliable.
-December 12th, 2016. Haplogroup E1b1a V38 has been divided into three subclades. Unfortunately, one of them, Z5994, with very old branching from others, is based on only three available haplotypes, so it is not much reliable. Also, many new samples have been added to R1a statistics, and some of its subclades in NevGen have been further divided.
-January 1st, 2017. Yesterday morning (31.12.2016.) we noticed that two biggest levels on NevGen (R1b and Level for longer haplotypes) stopped working, they were just hanging when data is entered. Several days before they worked normally. Other two shorter Levels worked like before. We could had not find any other valid reason for this malfunction except that on the Server some settings were changed, allowing now less memory to processes than before, which leads to failure of Levels with more data (about 10Mb in this case). In order to fix this problem, we decided to separate most of deep subclades of I and J into another two new Levels, which we already had planed before. Now it is done, there are two new Levels I and J, and in Level for longer haplotypes are left only more general subclades of those two haplogroups, those that were already present in Level for shorter haplotypes. Now, after it was decimated, Level for longer haplotypes works. Prediction is better when there are more subclades available, but here we had no choice. R1b Level still does not work, it seems the only way to put it back to work is to divide it, and make several Levels from it. But that way it would be crippled, so we shall see in next days what to do.
-January 21st, 2017. During last two months division of R1b haplogroup has been revised, many subclades have been divided into deeper subclades and many new haplotypes have been added into training data set for predictor. Last update for it was released about 10th of January. Several days after the same was done with haplogroup Q. Also, haplogroup G2a PF3359 has been added to predictor. Finally, haplogroup C has been revised, with some new subbranches and new haplotypes added into training data set for predictor.
-February 21st, 2017. We have been revising haplogroup I1 for few last weeks. Several new subclades have been added, and some of existing subclades have been divided. Haplogroup I2c in predictor has also been revised during the same period.
-February 27th, 2017. Haplogroup G2a > L497 has been revised. In level for longer haplotypes it has now been divided into 12 parts. Division is not perfect, since for some of its parts is available only small number of confirmed haplotypes. So, it's division might be considered as experimental.
-March 12th, 2017. Today we released the new feature in NevGen predictor called "restriction of prediction by already known SNP". We shall try to explain it on small example. Let suppose we have R1b haplotype which has been SNP tested to belong to L21 clade. Using that knowledge in Level for R1b, now we can try predicting it without considering any of supported R1b subclades which are not subclades of L21. This way the resulting list becomes shorter, predictor automatically gives probability 0 to all subclades known not belong to L21 and not display them in results. This way we can eliminate giving some probability to subclades we know are excluded by known SNP testing. In many cases this can improve prediction. For major haplogroup-specific levels (R1b,R1a,I,J), SNP can be chosen in the Window for Settings, which can be entered by pressing button on the left side of page. There is combobox (list) which is filled differently with SNP names for the every chosen level. List is for now empty for two general levels, for which it was not expected to be useful much. Later we shall add some SNPs into them at least for major haplogroups like E and G. We must emphasize that SNP lists are not meant to be exhaustive. They contain only minimal number of major SNPs that are needed to connect supported subclades into tree-like structure. Where there are several equivalent SNPs, only one of them is taken, usually the most known one.
-April 1st, 2017. Haplogroup O has been revised. Available new samples have been added into its statistics, and it now has more newer subclade names. Haplogroup O still does not have a lot of available haplotypes comparing to its old age and especially comparing with number of available haplotypes from western eurasian haplogroups. There is also shortage of 111 long haplotypes, comparing to Western Eurasia, which decreases quality of it's statistics. New is that now in generated picture statistics of top O subclade is compared with statistics of all supported O subclades, which can help to compare haplotype with subclade's signature. Haplogroup O support in NevGen, due to shortage of deep SNP tested haplotypes, is still far from what we wish it should be.
In last weeks subclades under R1b Z2103 in R1b Level have been revised, many new samples have been added to it's statistics and several new deeper subclades have been added, for example BY250 and BY611. There were also some changes elsewhere, for example subclade CTS5533 has been extracted from its parent U106 >> S4031, on the request of guy from Norway.
-April 23rd, 2017. During this month clade I1 L813 has been divided into several subclades. The same was done with clades CTS1977 and CTS6433 under I2a2-M223. Haplogroup R1b > U106 has been refreshed with new samples. During this, testing of reliability of NevGen's U106 subclades recognition was done, together with testing of reliability of I1 and R1a subclades recognition from Sweden Project, and R1b from public Ulster Heritage Project. Here you can see more detailed report about it's results.
-May 13th, 2017. On I Level subclades of I2a1 P37 have been refreshed. Subclade L161 ("Isles") has been divided into several major subclades. Also subclade S21825 has been divided into four of it's principal parts: L1294 ("France"), L880 ("Northern France"), Y11949 ("Alpine") and L233 ("Western"). Unfortunately, their statistics are made of small number of available samples.
Also, haplogroup D in predictor has been reorganized, and refreshed with new samples. It is still based on small number of available samples, so it is not much reliable.
Results of new testing of reliability of NevGen's R1b prediction are added here, with haplotypes from three projects from British Isles.
-June 4th, 2017. Several weeks ago haplogroup I2a2a M223 in I Level has been refreshed, and several of it's subclades have been divided into deeper subbranches.
In last two weeks haplogroup J1 has been refreshed with new samples from J1 Project known which subclade they belong, about two hundred of them. During this, testing of J1 subclade prediction has been done. For now it can be said that achieved result of right prediction is about 82%, but more detailed report shall be found soon here.
-August 3rd, 2017. Today is released new upgrade of NevGen code. Changes were made with calculation of probabilities of unsupported subclade, part of predictor that tries to cope with recognition of false positives. Till now there was only one statistics per subclade (supported by NevGen), for which were used all haplotypes with at least 37 markers. NevGen is now improved by having separate statistics for several STR sets, which should give better assesment of unsupported subclade probability for every of seven standard STR sets. There are now seven separate statistics, for 12, 25, 37, 67, 111 STR markers (all FTDNA STR sets), and for 17 and 23 markers (YFiler STR sets, widely used for scientific studies of world populations). Only exception is R1b Level, which holds only three statistics, for 37, 67 and 111 STR markers. Reason for omitting other four is technical, it already holds big amount of data (about 13Mb) and adding more could make further problems with server (if R1b Level hangs and does not displays results, try next trick, it allways worked for us: after entering a haplotype, select and calculate with any other level, for example take R1a. After its results are displayed, change Level to R1b and recalculate without changing a haplotype).
Also, in last two months many haplogroups have been refreshed with new haplotypes, and some existing subclades have been divided and some new subclades have been added.
-August 23rd, 2017. Bug is found and fixed which affected calculation of probability of unsupported subclade, making it in some cases lower than it should be. Bug was introduced with last changes of code, in August 3rd, 2017. We recommend to recalculate again and apologize for inconvenience.
-October 3rd, 2017. At end of August was finally released limited desktop edition of NevGen predictor, with Batch capability. It can be downloaded here, where you can see more about it. Today to desktop edition is added another utility, "NevGen probability Calculator of Time to Most Recent Common Ancestor".
-December 30th, 2017. Today has been added Level for haplogroup E, for now with 60 subclades (but some of them are paragroups). Subclades M81 and M84 has been further divided into several deeper subclades. Also, several months ago has been added rare subclade E2 (M75), for now based on 13 available haplotypes. Predictions in Level for haplogroup E can now be restricted by several basic SNPs, and it has several background (superclade) statistics to compare with statistics of first subclade. General level for longer haplotypes now holds reduced number of E subclades; for example V13, V12, V22 and some others are not deeper divided there.
In several previous months many changes were made, although nothing was reported here. For example, haplogroup G was revised in November, and some of it's clades have been further divided into more deeper subclades.
-January 10th, 2018. In this section can be downloaded tables of NevGen's coefficients of fitting of any subclade into another subclade (or, in other words, ability of NevGen algorithm to distinguish one subclade from another on given set of markers).
-January 15th, 2018. Today we added two new autosomal-oriented utilities to our desktop edition (you can see more about it in page NevGen Genealogy Tools v1.1). Also, E Level has been added to desktop edition of predictor.
Haplogroup N in Level for longer haplotypes has been reorganized. Now it contains 23 subclades instead of previous three. Former N1c has been divided into several subclades. Some of them are based on small number of available haplotypes, for example Y16323, Y9022 and M2019, so they might not be too reliable. On the other hand, some subclades, like L1022, CTS4329 and VL62 are based on more than hundred haplotypes each. We intend to more deeply divide N haplogroup in NevGen in future.
-January 30th, 2018. Subclade I-L38 has been divided into five of it's primary subclades in I Level. One of them, BY14072 is based on small number of available haplotypes (and only three of them with 111 markers), so it is not much reliable and tends to underrate haplotypes od it's subclade.
-August 5th, 2018. Algorythm of NevGen Predictor had not been changed for long time, sticking to Bayesian-Allele-Frequency Approach for years. But, few days ago it was slightly changed. When calculating probabilities and fitnesses, NevGen started to slightly increase weight to STR values which are part of subclade's STR signature, when comparing subclade's statistics to statistics of it's superclade (before this changes, weights of all STR values were allways 1.). Let see next sample picture with sample haplotype of subclade Z16988 under E-V13. There we can see that sample haplotype posseses three values which are part of Z16988 signature (whether it is complete or partial) when comparing with statictics of all V13 (please note that V13 has been chosen as superclade for background statistics by choosing "V13 (E1b...) *" in combo box "Known SNP", asterisk sign means here that chosen SNP has it's own superclade statistics). Signature values here are: DYS458 = 16, DYS447 = 25 and DYS570 = 21 (see picture beneath). In this sample predictor slightly increases weight of this three STRs, and weight of other STRs slightly decreases acordingly. This is the first use of STR signatures in calculation in NevGen predictor.
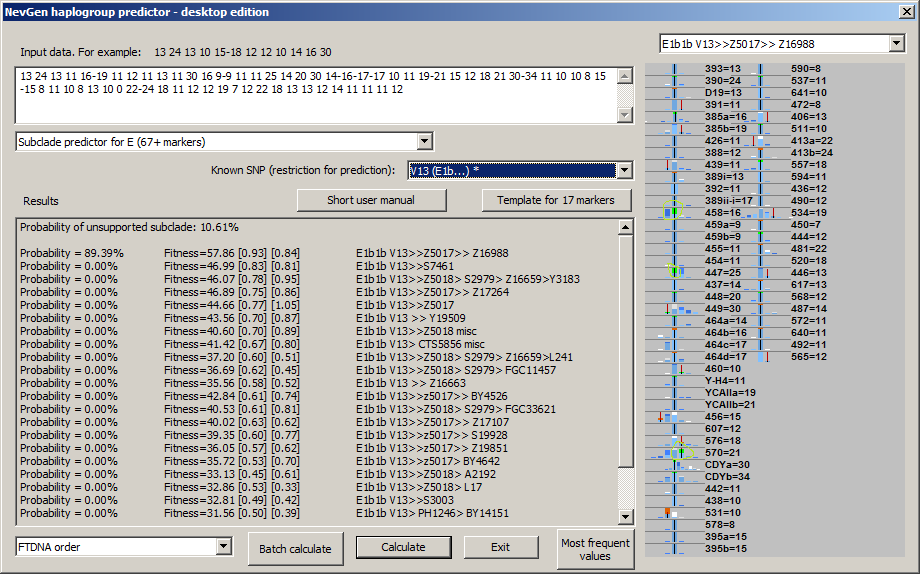
The latest change is restricted only to subclades with small number of available samples, because wrong predictions usually happens to them. There is no need to increase weight of signature STR values for subclades with large number of available samples, because they are rarely wrongly predicted.
This was tested on many previously unknown samples, and in several cases new modifications helped to get better prediction (right subclade was with the most of probability with new changes, and not first without them). In some cases new strategy made results worse, but such cases were greatly outnumbered with cases where it helped. So, it seems that new strategy makes predictor better. In future some internal parameters that govern increase of weight of signature might be finer tuned, but that should not make big difference. New changes were devised after man from England (who belongs to small R1b subclade with well defined STR signature) objected that predictor had not recognised some of its haplotypes.
-December 30th, 2018. NevGen Genealogy Tools has been updated. Now is available J Level in Predictor.
-July 31st, 2019.

For more details, about previous testing (January 1st - July 31st, 2019) please see here
Comparative overview of distribution of Y-DNA haplogroups in Europe and Arab countries
-April 20th, 2021. Few days ago has been added Level for haplogroup N, for now with 70 subclades (some of them are paragroups). Subclades VL62, CTS4329 and CTS6380 have been further divided into several deeper subclades, and for all three of them is available background (superclade) statistics, which can be put into use when selecting their SNP in "Settings". General level for longer haplotypes now holds reduced number of N subclades, only five of them.
-In May 2021. was added Level for haplogroup G. Some of its subclades have been further divided into several deeper subclades. General level for longer haplotypes now holds reduced number of G subclades.
-August 28th, 2021. During month of August 2021 the small improvement of NevGen's algorithm was released. In minority of cases, predictor might predict deeper subclade of those which appear in list, by recognising STR signature which is typical for deeper subclade, but not for its parent subclade which is available in the list.
Now result f prediction might look like this:
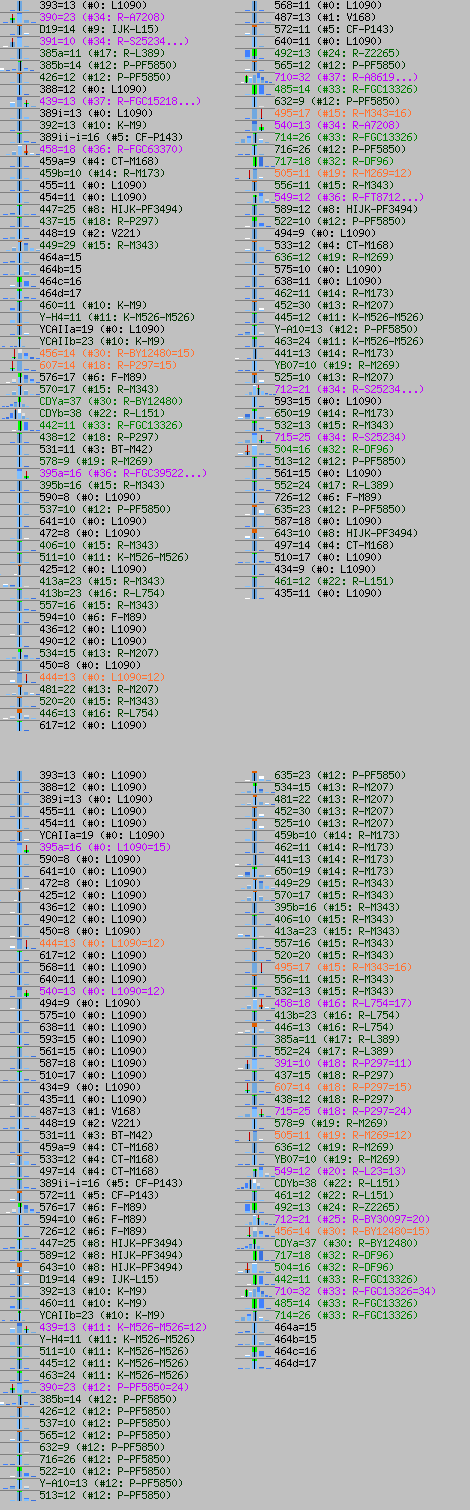
Probability = 100.00% Fitness=79.80 [1.22] R1b U106>S12025> S17339 (possibly FT4603(537=11, 710=37, 533=13))
Here we can see that predictor has detected STR signature DYS537=11, DYS710=37, DYS533=13, which is typical for downstream SNP FT4603, but not for any other subclade of its upstream S17339.
NevGen can now recognise STR signatures in length from one up to five. STR signatures of length 1 are very rare. Please be aware that those deeper subclade predictions might be wrong. This is especially true for those of length 2. Those of lengths 3, 4 and 5 are more reliable, but even there wrong predictions might happen. Reason for that are available training sets of haplotypes for various subclades, which are not much numerous in most of cases.
Beware that such deeper subclade predictions are not available in most of cases, they occur from 5% to 17% of haplotypes, depending of haplogroup (in some of them are more often, in some less).
Despite this upgrade of NevGen is helpful in only small percentage of haplotypes, nevertheless it took about three hundred hours of work during three and half months, more for data prepairing and testing than for programming.
Inconsistency between genotyped STRs and SNPs in scientific paper
-December 4th, 2021. This summer (August 23, 2021) was published scientific paper named "Comparative Y-chromosome analysis among Cypriots in the context of historical events and migrations", by Moutsouri et al 2021.Here is link: https://journals.plos.org/plosone/article?id=10.1371/journal.pone.0255140
They used 23 Y-chromosome STRs and 28 Y-chromosome SNPs to genotype 57 Maronite Cypriots and 56 Armenian Cypriots, 113 men in total. They also used NevGen Predictor to predict all those haplotypes and they found that 6 predictions out of 113 samples did not match basic haplogroups they found out from genotyping 28 basic haplogroup-determining SNPs.
Citation:
"Most of the samples were assigned to their predicted haplogroup, in accordance with the Y-DNA Haplogroup Predictor NEVGEN tool, with the exception of 6 samples out of the 113, which were assigned to a different haplogroup. Predicted and assigned Y-haplogroup for each individual is shown in S2 Table. The percentage error of the predicted Y-haplogroup was 5.31%."
So, they found that percentage error of NevGen's predictions is 5.31%. Luckily, they made public all haplotypes, so I could check all 6 disputable haplotypes.
Here they are, all six of them, together with NevGen's prediction and haplogroup they designated to them by SNP testing.
[31] 17 12 20 29 15 12 23 14 11 9 15 18 21 23 12 12 9 12 16 14 17 14 11 J2a1 Z6065> Z7532 J2a1a1a2a J2b Sequencing
[56] 16 14 21 32 14 10 30 13 12 10 14 18 22 23 12 11 9 12 19.2 13 18 15 11 J1a3 Z1828 J1a2b E1b1b MALDI-TOF
[57] 13 11 20 28 15 10 25 13 13 10 17 19 20 22 11 11 12 14 15 14 16 15 11 I1 Z58>Z59> Z60>Z140> FGC22406 I1a2a1a1a5~ F Sequencing
[A04] 16 12 21 29 16 11 21 12 10 10 16 18 21 22 12 10 11 14 18 13 16 15 11 G2a1 Z6552 G2a1 R2 MALDI-TOF
[A42] 17 13 19 30 15 10 23 11 12 10 16 16 22 23 12 13 11 11 14 13 17 15 10 L1b M317 L1b R1b MALDI-TOF Sequencing
[A77] 19 13 19 29 14 10 23 12 11 11 14 18 20 23 12 11 9 12 19.2 11 17 15 11 J1a >> PH77 J1a3~ R1a MALDI-TOF Sequencing
I throughly examined all of them, and I found that in 4 cases there is huge discrepancy between haplotypes and SNPs they genotyped.
Let see haplotype [56] first. It is predicted by NevGen as "J1a3 Z1828", and it is certainly J1. Just look at its value of DYS458, which is incomplete. It is 19.2! It is well known feature of J1 to have .2 attached to DYS458 value (incompleted). Beside J1, I know for only two very small subclades of R1b which have .2 value on DYS458. Also, NevGen Predictor does not even use those .2 value for prediction. It uses only value before decimal point. Using general Level for prediction, I got
Probability = 77.14% Fitness=36.18 [0.88] J1a3 Z1828
Note that both fitnesses are high, so this prediction cannot be problematic. Also, on J Level of predictor, I got even better fitnesses into deeper subclades.
Probability = 54.38% Fitness=39.08 [0.83] J1a3 Z1828> Z1842> Z18436> ZS3042
Probability = 9.81% Fitness=37.79 [0.82] J1a3 Z1828> Z1842> Z18436
Probability = 0.01% Fitness=28.91 [0.50] J1a3 Z1828> Z1842> Z18436> CTS1460> Y97265
When I put this haplotype into E Level of Predictor, I got:
Probability of unsupported subclade: 100.00%
Warning: Values of fitness (or relative fitness) are rather small, so results are not too confident. It is possible that its haplogroup is not supported by current version of predictor (so called "FALSE POSITIVE"), or haplotype really belongs to some supported haplogroup, but it is rare or too distant branch, which is not sufficiently represented in samples used by predictor.
Probability = 0.00% Fitness=11.08 [0.29] E1b1b V22
Probability = 0.00% Fitness=10.48 [0.24] E1b1b V1515> V1700
Please note too low values of both fitnesses into first ranking E subclade. From my experience, it means that prediction is not valid (even if it gives bigger than 0 probability). So, I am certain this haplotype in no way could represent haplogroup E, but it must belong to haplogroup J1.
Similar situation is for haplotype [A77]. It is also obvious J1, it also has .2 value on DYS458, beside having perfect fit into J1, and awfull fitting into R1a (as SNP says, which must be wrong). Here are predictions in two levels. First, in J Level of NevGen Predictor:
Probability = 100.00% Fitness=54.16 [1.17] J1a2 > ZS6599
Probability = 0.00% Fitness=29.72 [0.52] J1a >> P58>> ZS3668
Then in R1a Level of NevGen Predictor:
Probability of unsupported subclade: 100.00%
Warning: Values of fitness (or relative fitness) are rather small, so results are not too confident. It is possible that its haplogroup is not supported by current version of predictor (so called "FALSE POSITIVE"), or haplotype really belongs to some supported haplogroup, but it is rare or too distant branch, which is not sufficiently represented in samples used by predictor.
Probability = 0.00% Fitness=8.64 [0.17] R1a Z282> Y17491
Probability = 0.00% Fitness=8.38 [0.14] R1a Z282>Z280> CTS1211>YP1019
Haplotype [A42] cannot be R1b at any circumstances, and it is obvious L1b. Readers can just compare fitnesses.
Probability = 99.99% Fitness=56.69 [1.11] L1b M317> SK1412> PH3524
Probability = 0.01% Fitness=38.36 [0.87] L1b M317> SK1412> SK1414
Probability = 0.00% Fitness=18.81 [0.42] L1b M317> M349
...
Probability = 0.00% Fitness=8.33 [0.20] R1b V88
Probability = 0.00% Fitness=7.44 [0.18] R1b (for 67+ markers, try level for R1b-s, 300+ subclades)
Next are two images of fitting of haplotype [A42] into two haplogroups. You can see many off values in R1b case.


And haplotype [A04], again wrong SNP. Cannot be R2 in any way, but G2a. Here can be seen fitnesses in predictor's General Level.
Probability of unsupported subclade: 7.95%
Probability = 58.38% Fitness=39.81 [0.80] G2a1 Z6552 > L293 >> Z7940
Probability = 21.81% Fitness=38.12 [0.79] G2a1 Z6552 > L293 >> FGC1160
Probability = 11.66% Fitness=37.15 [0.69] G2a1 Z6552 > L293 >> Z31459
Probability = 0.12% Fitness=31.27 [0.75] G2a1 Z6552
Probability = 0.06% Fitness=29.81 [0.75] G2a2b1 M406 (for 67+ markers, try level for G-s)
Probability = 0.00% Fitness=26.75 [0.56] G2a2b2a1b - L497 (for 67+ markers, try level for G-s)
...
Probability = 0.00% Fitness=5.94 [0.17] R2 M479
For the last two haplotypes, [31] and [57], I think SNP readings are good.
In case of [57], NevGen does not support haplogroup F, due to low number of available haplotypes. And NevGen's prediction (General Level) is this:
Probability of unsupported subclade: 92.06%
Warning: Values of fitness (or relative fitness) are rather small, so results are not too confident. It is possible that its haplogroup is not supported by current version of predictor (so called "FALSE POSITIVE"), or haplotype really belongs to some supported haplogroup, but it is rare or too distant branch, which is not sufficiently represented in samples used by predictor.
Probability = 7.80% Fitness=16.53 [0.36] I1 (for 67+ markers, try level for I-s, 40+ subclades)
Probability = 0.13% Fitness=15.41 [0.42] E1a M132
Probability = 0.01% Fitness=13.44 [0.36] I2a2a M223 (for 67+ markers, try level for I-s)
Probability = 0.00% Fitness=12.80 [0.27] G2a2b2a1b - L497 (for 67+ markers, try level for G-s)
Probability = 0.00% Fitness=10.11 [0.25] G2a2b1 M406 (for 67+ markers, try level for G-s)
Probability = 0.00% Fitness=9.13 [0.23] G2a2a PF3147
Here can be seen warning and too low fitnesses, in which case I just ignore any possible probability. So, in this case, I would just take as that NevGen cannot decide to which haplogroup this haplotype belongs.
And for the last haplotype [31], which has SNP reading for haplogroup J2b, prediction in General Level is (version of December 4th 2021):
Probability of unsupported subclade: 71.73%
Warning: Values of fitness (or relative fitness) are rather small, so results are not too confident. It is possible that its haplogroup is not supported by current version of predictor (so called "FALSE POSITIVE"), or haplotype really belongs to some supported haplogroup, but it is rare or too distant branch, which is not sufficiently represented in samples used by predictor.
Probability = 22.10% Fitness=23.19 [0.51] J2b2a M241
Probability = 5.13% Fitness=23.63 [0.55] J2b2b PH1648
Probability = 0.75% Fitness=21.28 [0.51] J2b1 M205
Probability = 0.29% Fitness=20.89 [0.57] J2a1 Z7700
Prediction of the same haplotype in J Level is (version of December 4th 2021):
Probability of unsupported subclade: 52.46%
Warning: Values of fitness (or relative fitness) are rather small, so results are not too confident. It is possible that its haplogroup is not supported by current version of predictor (so called "FALSE POSITIVE"), or haplotype really belongs to some supported haplogroup, but it is rare or too distant branch, which is not sufficiently represented in samples used by predictor.
Probability = 47.42% Fitness=28.29 [0.66] J2b1 M205 >> CTS1969
Probability = 0.09% Fitness=23.88 [0.55] J2b2b PH1648
Probability = 0.01% Fitness=22.75 [0.44] J2a1 Z7700> Z40168
Probability = 0.00% Fitness=21.51 [0.52] J2a2 PF5008 >> PF5040
Probability = 0.00% Fitness=20.58 [0.43] J2b2а M241>>CTS3617
Maybe predictor's version from earlier this year really gave biggest probability to J2a instead of J2b, I am not sure. And I cannot check it now. So, I accept this prediction of NevGen as wrong. Obviously, NevGen Predictor cannot clearly decide to what branch of J2 this haplotype belongs.
That still makes at most two errors on NevGen's side, not 6. This scientific paper is not the first in which NevGen Predictor was used for predicting of haplotypes, but it is the first in which I noticed inconsistency between genotyped STR haplotypes and genotyped SNPs. I am sure this is error on their side, not on NevGen's side. But I cannot say whether it is because of possible human error, error of DNA sequencing, DNA contamination error, or any other kind of error. But I strongly suggest to people who are doing such scientific papers to be cautious and to thoroughly double check for errors in cases where STR haplotypes are inconsistent with SNPs, just like were in these four cases. And not to automatically put blame on NevGen Predictor. I wrote to authors more than month ago about this, but I received no answer.
-December 13th, 2021.
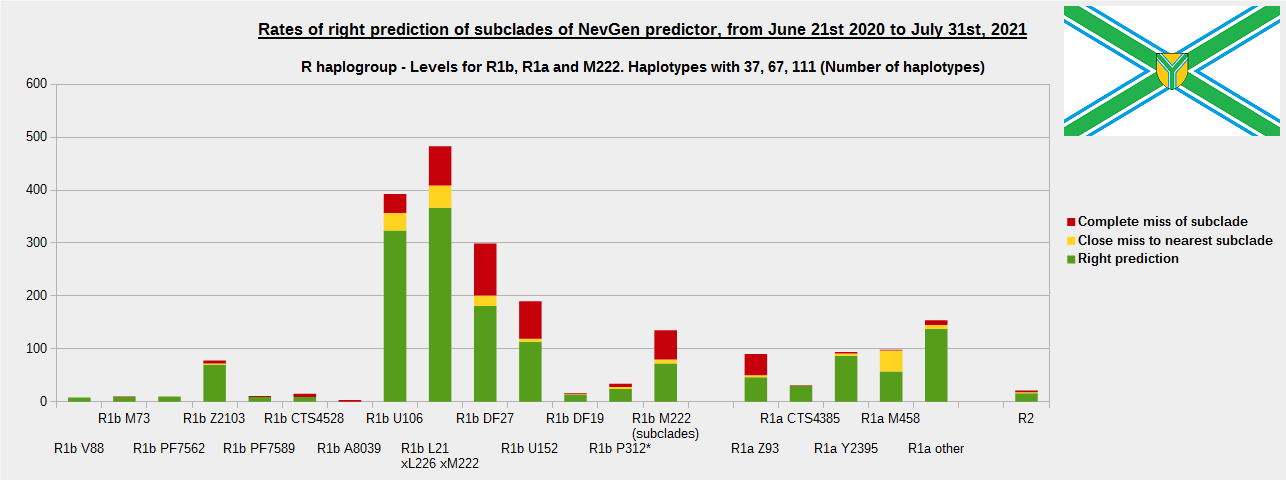
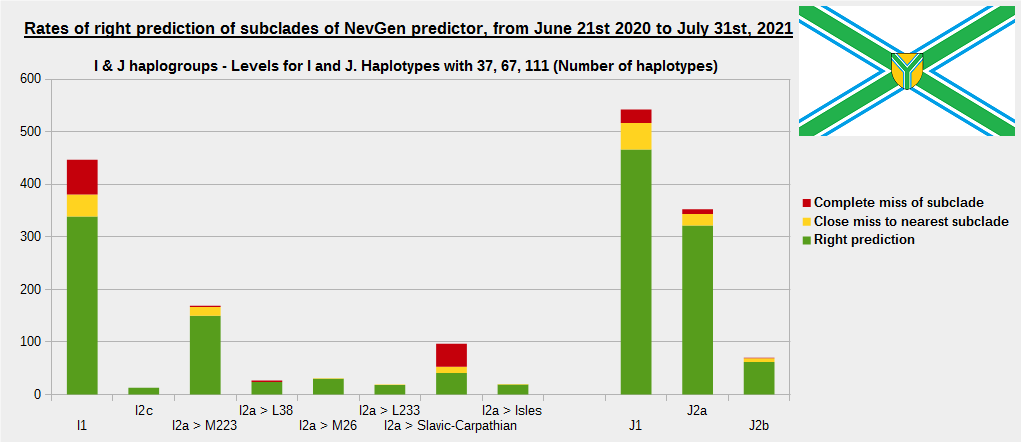
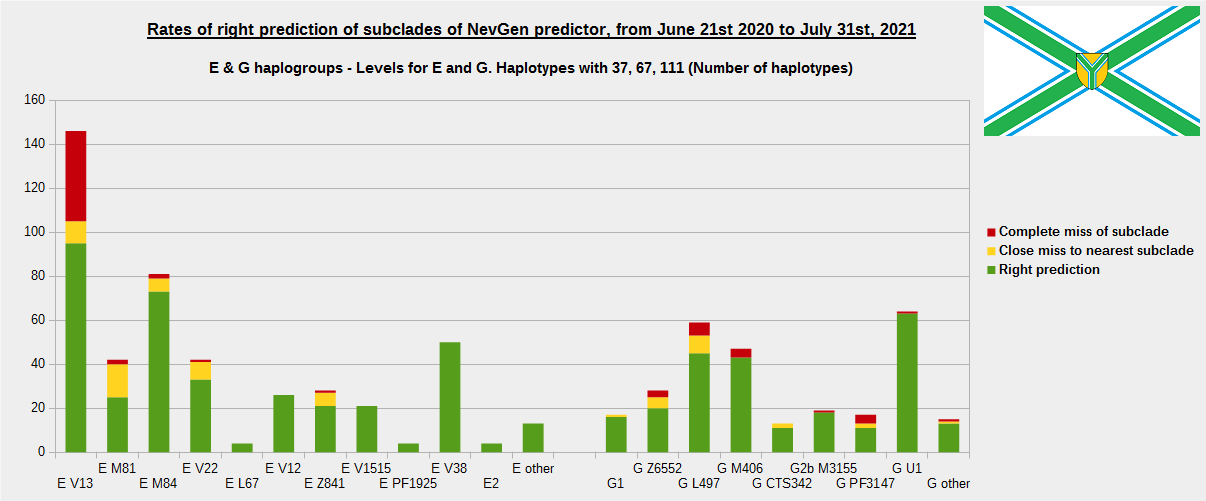
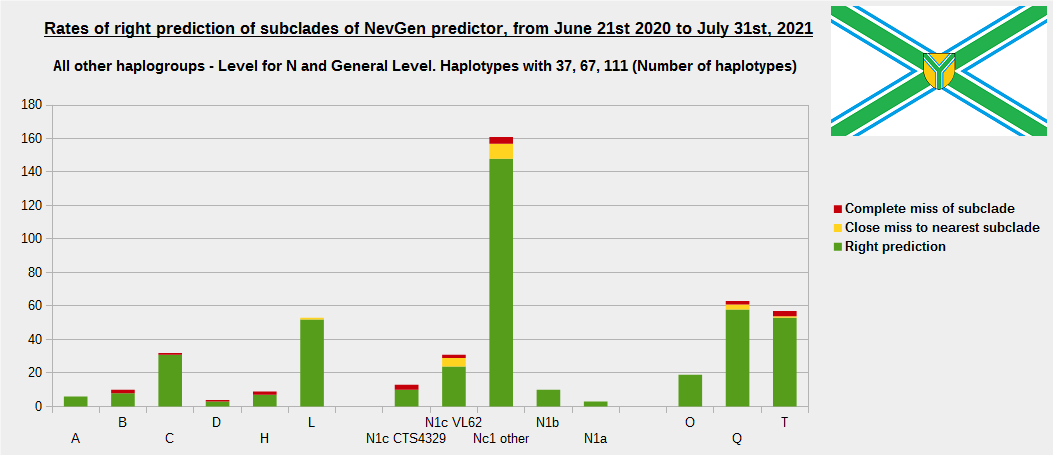
For more details, about previous testing (June 21st 2020 - July 31st, 2021) please see here
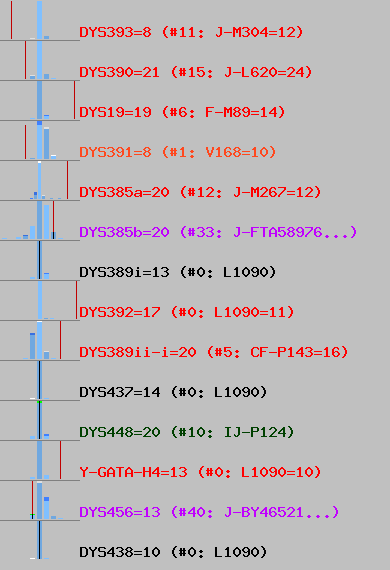
-February 13th, 2022. Today are released changes (improvements) to generated images with visual statistics. Statistics for STRs now might contain node (SNP) in YDNA-Haplotree of humankind where current STR value most probably occured. Here is sample image.
Now I shall not try to describe it more throughly, but it will be done soon, as soon as I find time for it. We used (somewhat simplified) FTDNA's Public YDNA-Haplotree. I hope more advanced users (like FTDNA Projects Admins) shall easily understand what newly added data means. We used our own algorithm to determine most probable STR values for every node in haplotree. Due to technical reasons, new data is not displayed for every subclade, for now.
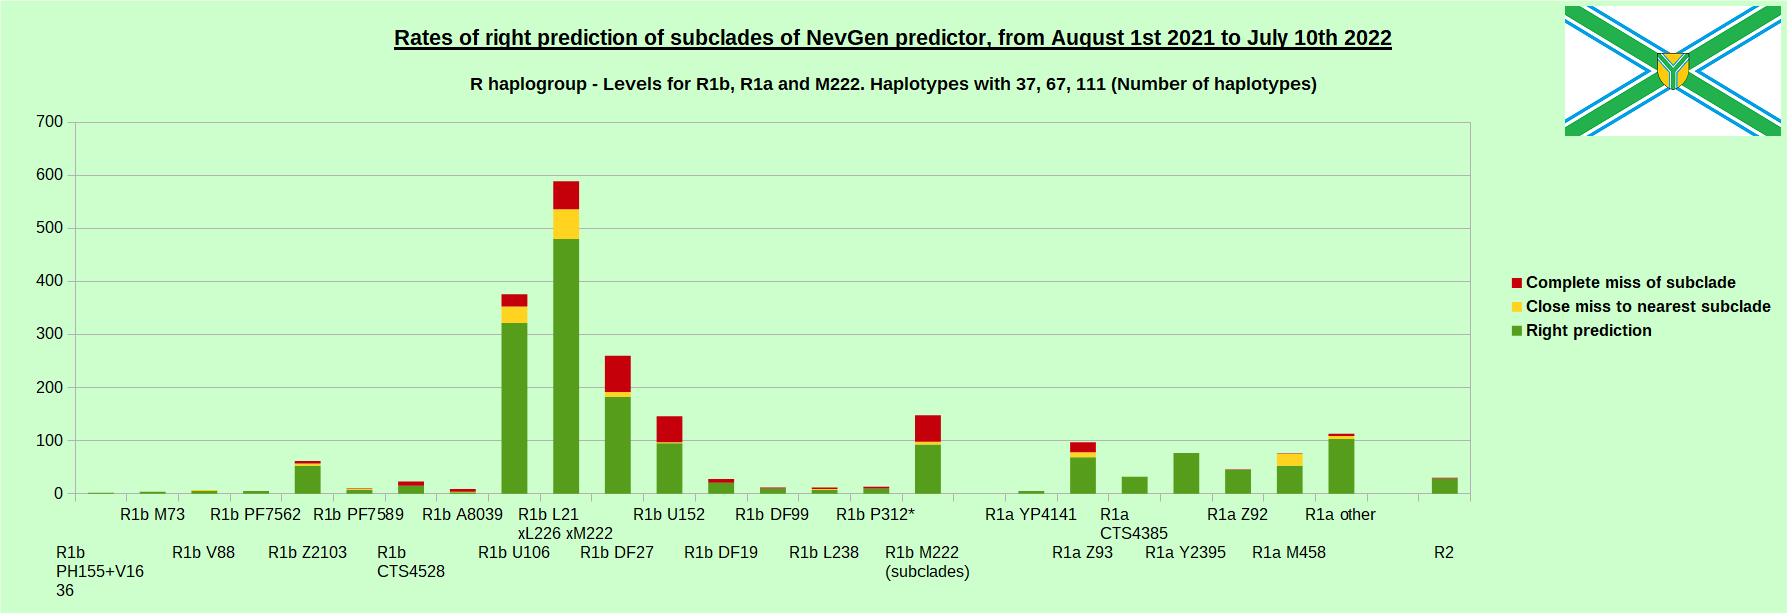
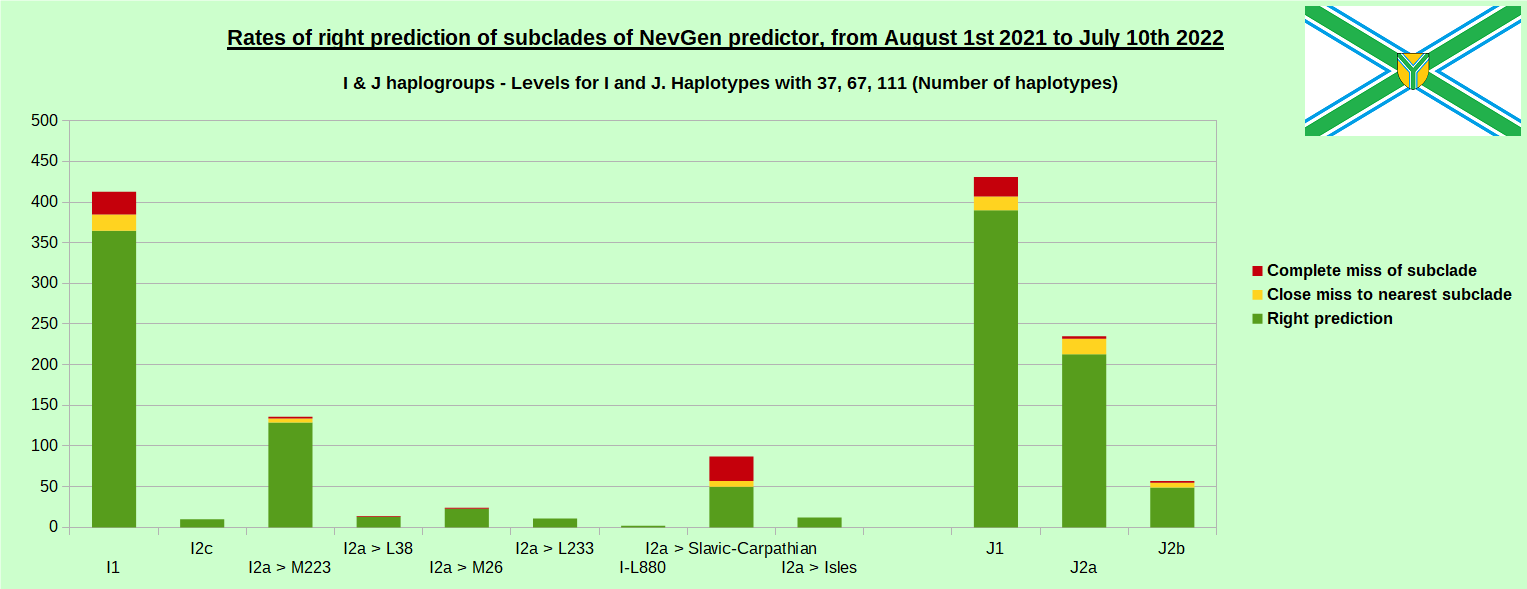
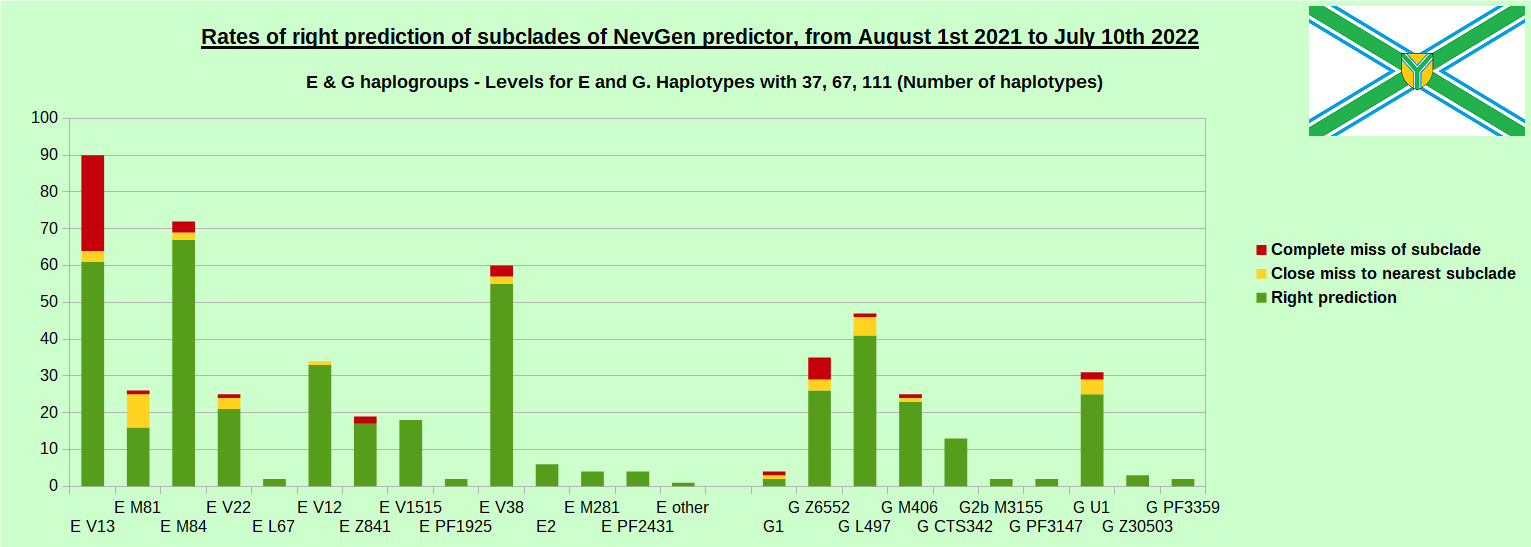
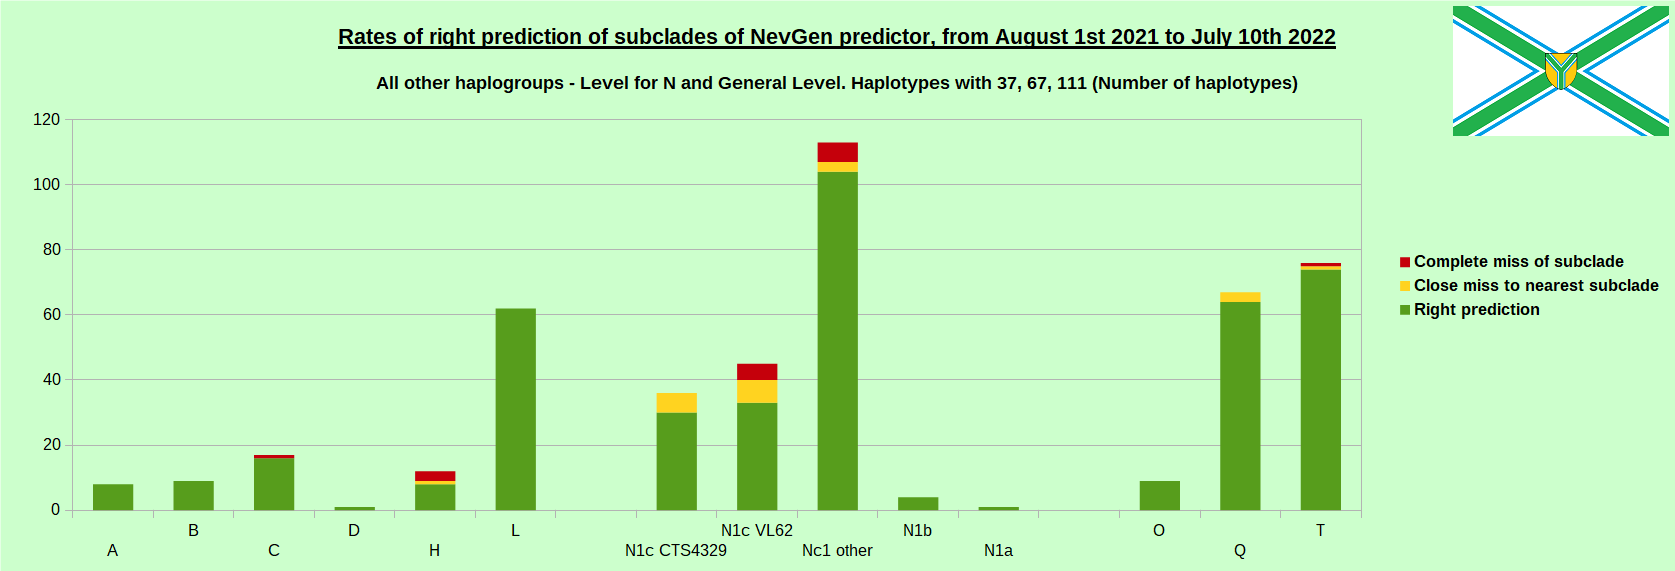
-July 29th, 2022. Results of new testing of NevGen Predictor.
For more details then next four images, about this testing (August 1st 2021 - July 10th, 2022) please see here
-October 2nd, 2022. Visits to NevGen Predictor's site (nevgen.org), by year.
Today we present to our visitors informations about visits to our site. Nevgen Predictor started working on Internet in December 8th 2015.
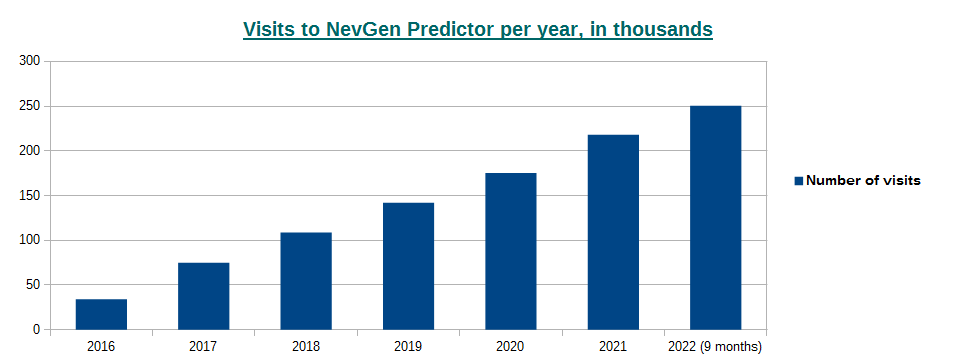
In year 2016 number of visits was 34,026 (average time spent was 3min 4sec),
2017: 74,767 (2m 45s),
2018: 108,619 (2m 14s),
2019: 142,051 (2m 21s),
2020: 175,414 (2m 19s),
2021: 218,262 (2m 17s),
2022 (first 9 months, from January 1st till September 30th): 250,515 (1m 57s), which gives average of about 918 visits per day.
While number of visits per year is rising, we see that average time spent is decreasing. I must admit that I do not know if a visitor calculates several haplotypes in sequence, does it counts as one visit or more.
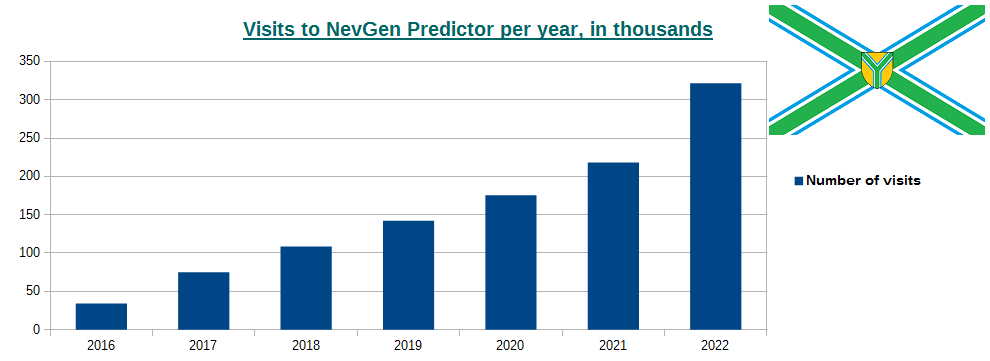
-January 2nd, 2023. Updated visits to NevGen Predictor's site (nevgen.org), by year.
Updated visit information to our site, after year 2022 has completed. In 2022 we had 321.739 visits, which is 47.41% increase comparing with previous year 2021. This year average visit lasted for only 1m 46s, which I believe is consequence that more and more guys are founding the way to call NevGen prediction automatically, for example through their own Python code.
-April 25th, 2023. My thoughts about supposed haplotype of Ramesses III and its prediction.
At least twice we received emails asking about NevGen's prediction of haplotype of Ramesses III.
His haplotype is supposed to be this, in NevGen format:
8,21,19,8,20-20,0,0,0,13,17,33,0,0-0,0,0,0,14,20,0,0-0-0-0,0,13,0-0,13,0,0,0,0-0,0,10
Predicting it in General Level of predictor I got this:
Probability of unsupported subclade: 100.00%
Warning: Values of fitness are too small. Probably is error in order of STRs!
Probability = 0.00% Fitness=0.43 [0.01] J1a2a1a2 P58
Probability = 0.00% Fitness=0.88 [0.02] E1b1b V22
Probability = 0.00% Fitness=0.68 [0.02] Q M346>> Z780
Probability = 0.00% Fitness=0.66 [0.01] D1a1a2 F1070
Probability = 0.00% Fitness=0.66 [0.01] A0a V148
Probability = 0.00% Fitness=0.61 [0.02] Q M346>> M3> M902
Probability = 0.00% Fitness=0.55 [0.01] I2a1 S21825>> L880 ("Northern France")
Probability = 0.00% Fitness=0.51 [0.01] Q F1096> M25
Probability = 0.00% Fitness=0.45 [0.01] O1a1 > CTS5726
Probability = 0.00% Fitness=0.44 [0.01] E1b1b > V12
Probability = 0.00% Fitness=0.43 [0.01] Q M346>> M3
.
.
.
Probability = 0.00% Fitness=0.05 [0.00] G2a2 >> M278
Probability = 0.00% Fitness=0.05 [0.00] Q M346> YP4004
Probability = 0.00% Fitness=0.04 [0.00] R1a YP1272
Probability = 0.00% Fitness=0.03 [0.00] T >> CTS11451> Y4119>> Y29991
Probability = 0.00% Fitness=0.02 [0.00] C2b1a1b1 F3985
Probability = 0.00% Fitness=0.02 [0.00] A00
You can see most of values look like being out of normal, by position of red vertical line. It fits into it like elephant fits into glass shop.
From it, I suspected some values from this haplotype might be random (i.e. wrong). So, few days ago I wrote code which generates random haplotypes, using the same STRs which are part of Ramesses's haplotype.
I generated two hundred such haplotypes, and average top fitness of predictions of all those random haplotypes was 0.12%, which is something lower than 0.43% for supposed haplotype of Ramesses III.
Here are some samples of them:
9,21,15,9,10-21,0,0,0,16,10,23,0,0,0,0,0,11,25,0,0,0,7,0,9,0,0,0,0,0,11
15,20,13,6,16-21,0,0,0,17,19,36,0,0,0,0,0,15,23,0,0,0,22,0,22,0,0,0,0,0,12
11,28,12,12,7-11,0,0,0,14,17,35,0,0,0,0,0,20,16,0,0,0,22,0,17,0,0,0,0,0,14
14,20,13,10,10-20,0,0,0,13,15,25,0,0,0,0,0,11,20,0,0,0,14,0,22,0,0,0,0,0,7
17,21,18,7,12-20,0,0,0,15,16,24,0,0,0,0,0,21,17,0,0,0,14,0,22,0,0,0,0,0,12
13,28,13,14,10-20,0,0,0,17,13,21,0,0,0,0,0,17,17,0,0,0,24,0,18,0,0,0,0,0,15
10,22,11,7,17-22,0,0,0,11,6,44,0,0,0,0,0,12,17,0,0,0,7,0,19,0,0,0,0,0,11
13,26,13,11,16-18,0,0,0,15,8,26,0,0,0,0,0,15,9,0,0,0,7,0,22,0,0,0,0,0,15
Then I made several other sets of random haplotypes, which contain from 1 to 13 real values (randomly chosen which will be taken) from real haplotype, which belongs to E1b1a V38>> M4231, and the rest of values are random numbers.
Real haplotype, which is used to borrow values from it, is:
13,21,15,11,16-17,0,0,0,13,11,31,0,0,0,0,0,14,21,0,0,0,11,0,15,0,0,0,0,0,10
Here you can see table of average fitnesses for top prediction for all haplotypes of partially random generated haplotypes, 200 of haplotypes in each group. Grops are sorted by number of values which are taken from real haplotype.
0 0.12% (200 random haplotypes - All 14 values are random)
1 0.18% (200 haplotypes - 1 value is from real haplotype, 13 other values are random)
2 0.33% (200 haplotypes - 2 values are from real haplotype, 12 other values are random)
3 0.58% (200 haplotypes - 3 values are from real haplotype, 11 other values are random)
4 0.90% (200 haplotypes - 4 values are from real haplotype, 10 other values are random)
5 1.57% (200 haplotypes - 5 values are from real haplotype, 9 other values are random)
6 2.52% (200 haplotypes - 6 values are from real haplotype, 8 other values are random)
7 3.56% (200 haplotypes - 7 values are from real haplotype, 7 other values are random)
8 5.04% (200 haplotypes - 8 values are from real haplotype, 6 other values are random)
9 7.12% (200 haplotypes - 9 values are from real haplotype, 5 other values are random)
10 9.94% (200 haplotypes - 10 values are from real haplotype, 4 other values are random)
11 13.78% (200 haplotypes - 11 values are from real haplotype, 3 other values are random)
12 20.26% (200 haplotypes - 12 values are from real haplotype, 2 other values are random)
13 31.03% (200 haplotypes - 13 values are from real haplotype, 1 other value is random)
14 52.13% (All 14 values are from real haplotype)
From table you can see that top fitness of supposed Ramesses's haplotype (0.43%) fits between average fitnesses (0.33% and 0.58%) with 2 and 3 real values and all other random values.
So, it seems to me that most probably only 2-4 values of Ramesses's haplotype are real, and all others are wrong (random) values. Unless Ramesses III belonged to major haplogroup which is not present in modern humanity. Or is very, very rare. If Ramesses III has been not proven by SNPs to belong to E1b1a, from his STRs I can not deduce anything for certain.
On youtube is video about NevGen Predictor's prediction of Ramesses haplotype.
https://www.youtube.com/watch?v=zlrQ33MtO7Q - Reevaluating Ramesses III & Unknown Man E Y-STR Markers Using NevGen Haplogroup Predictor
I must renounce prediction on Level R1b, which assigns nonzero percentage to some of R1b subclades. It is because of imperfection of R1b Level to work with short haplotypes, due to technical reasons. It simply misses statistics (server cannot load it) for small number of markers, which enables probability of unsupported subclades to be calculated. Because of it, for this "bikini" haplotype 100% of probability is distributed to some subclades of R1b, which is not meaningful result, because of too small fitnesses. That is why R1b Level is neither meant nor recommended for use with short haplotypes.